Abstract
The growth of urban solar installations will increase the demand for decommissioning and recycling. This review examines treatment technologies for end-of-life photovoltaic (PV) modules, recycling costs, and the responsibilities of market participants. It draws on research publications, IRENA and IEA PVPS reports, national statistics, legislation, and company disclosures available through 9 November 2026. Industrial recycling still relies mainly on mechanical treatment. Recovering silver and silicon suitable for use in manufacturing requires delamination and purification. Results from laser and abrasive delamination and aqueous perovskite recycling have yet to be demonstrated in continuous industrial operation. Comparable global recycling statistics are unavailable. In France, 83.9% of the module mass treated in 2025 went to material recycling. The main economic barriers are low plant utilization, dismantling and transport costs, low glass prices, and weak incentives to recover valuable components. A comparison of seven cities identifies three deployment models. The proposed full solar life cycle city model combines an installation registry, pre-decommissioning assessment, batch consolidation, and supplier requirements. It also specifies metrics for tracking where recovered materials go and identifies tasks that artificial intelligence can support.
Keywords photovoltaic modules; solar panel recycling; delamination; silver recovery; circular economy; urban solar deployment; smart city; extended producer responsibility; artificial intelligence; life cycle
Full Article
22 pages · 9 tables · 57 references
Open the complete article PDF ↗
Read the text version
Page 1
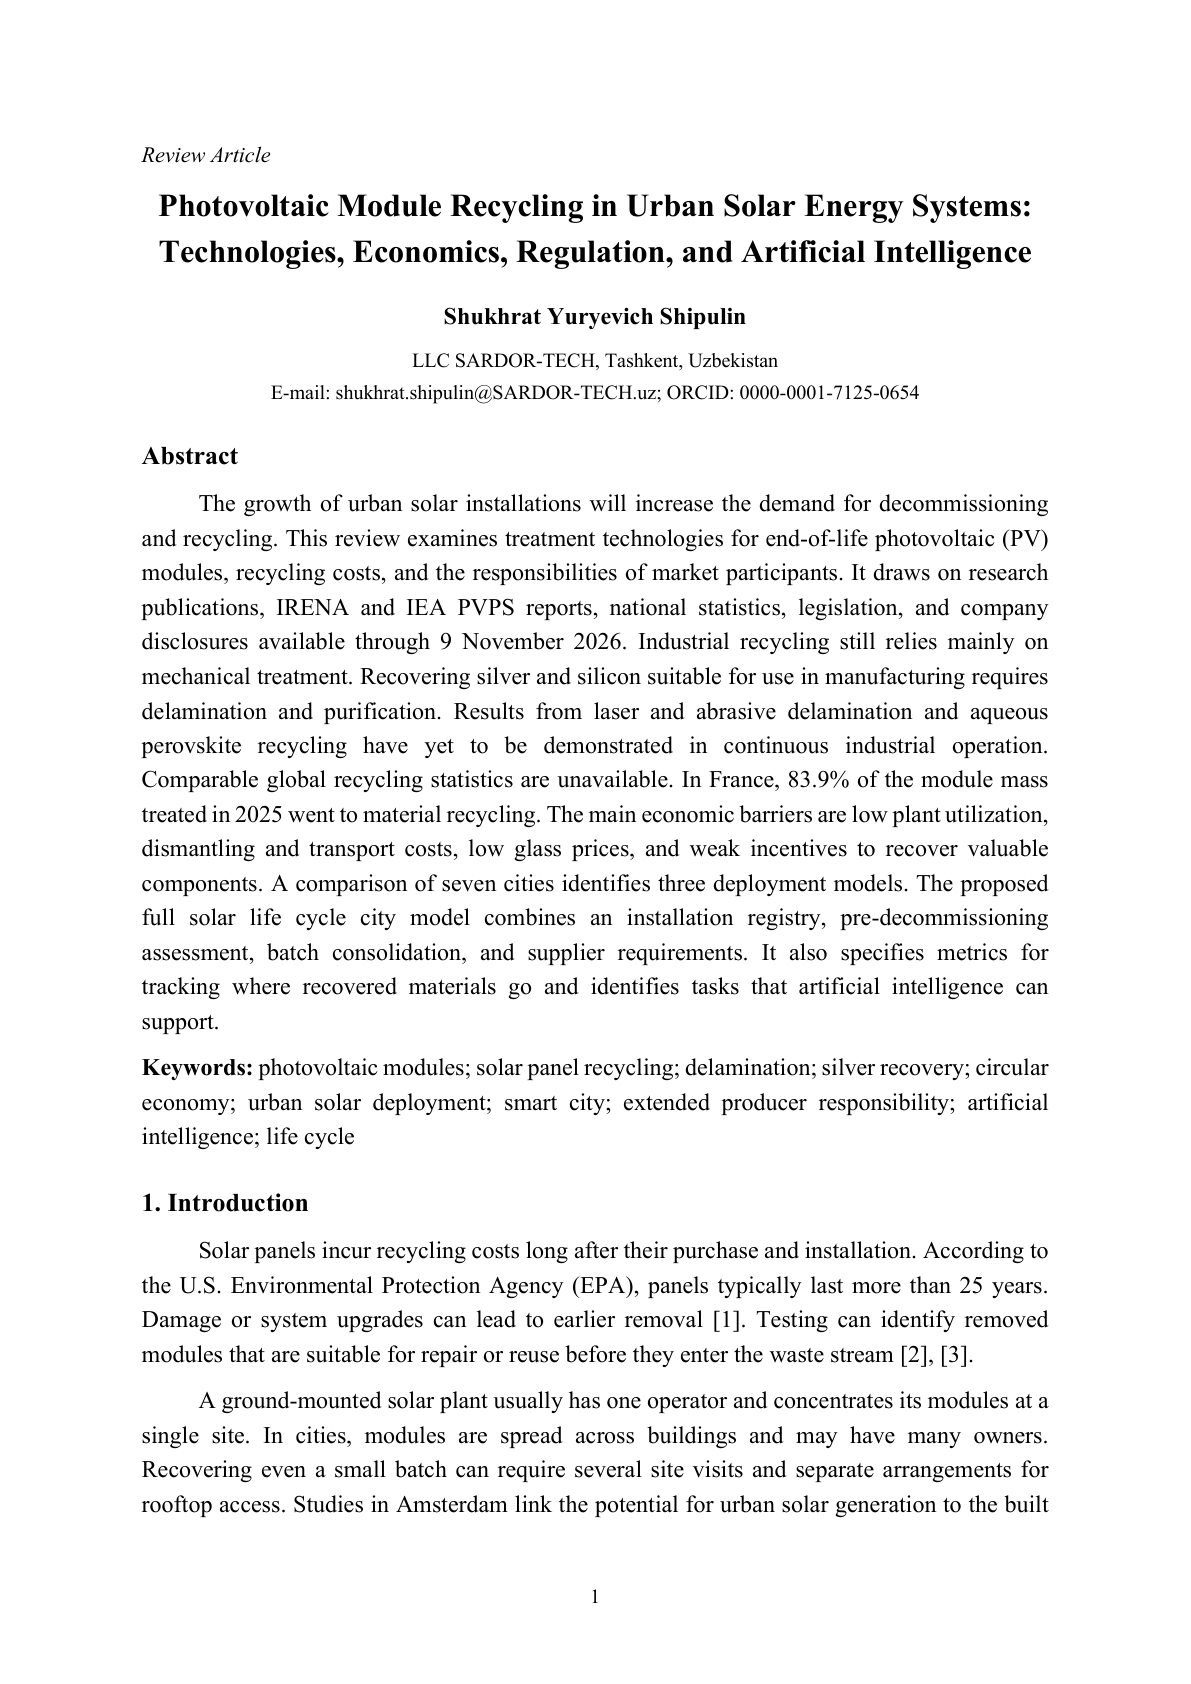
Review Article
  Photovoltaic Module Recycling in Urban Solar Energy Systems:
  Technologies, Economics, Regulation, and Artificial Intelligence

                                      Shukhrat Yuryevich Shipulin

                                  LLC SARDOR-TECH, Tashkent, Uzbekistan
                E-mail: shukhrat.shipulin@SARDOR-TECH.uz; ORCID: 0000-0001-7125-0654

Abstract

       The growth of urban solar installations will increase the demand for decommissioning
and recycling. This review examines treatment technologies for end-of-life photovoltaic (PV)
modules, recycling costs, and the responsibilities of market participants. It draws on research
publications,  IRENA  and  IEA  PVPS  reports,  national  statistics,  legislation,  and  company
disclosures  available  through  9  November  2026.  Industrial  recycling  still  relies  mainly  on
mechanical treatment. Recovering silver and silicon suitable for use in manufacturing requires
delamination  and  purification.  Results  from  laser  and  abrasive  delamination  and  aqueous
perovskite   recycling   have   yet   to   be   demonstrated   in   continuous   industrial   operation.
Comparable global recycling statistics are unavailable. In France, 83.9% of the module mass
treated in 2025 went to material recycling. The main economic barriers are low plant utilization,
dismantling  and  transport  costs,  low  glass  prices,  and  weak  incentives  to  recover  valuable
components. A comparison of seven cities identifies three deployment models. The proposed
full  solar  life  cycle  city  model  combines  an  installation  registry,  pre-decommissioning
assessment,  batch  consolidation,  and  supplier  requirements.  It  also  specifies  metrics  for
tracking  where  recovered  materials  go  and  identifies  tasks  that  artificial  intelligence  can
support.
Keywords: photovoltaic modules; solar panel recycling; delamination; silver recovery; circular
economy;  urban  solar  deployment;  smart  city;  extended  producer  responsibility;  artificial
intelligence; life cycle

1. Introduction

       Solar panels incur recycling costs long after their purchase and installation. According to
the U.S. Environmental Protection Agency (EPA), panels typically last more than 25 years.
Damage  or  system  upgrades  can  lead  to  earlier  removal  [1].  Testing  can  identify  removed
modules that are suitable for repair or reuse before they enter the waste stream [2], [3].

       A ground-mounted solar plant usually has one operator and concentrates its modules at a
single  site.  In  cities,  modules  are  spread  across  buildings  and  may  have  many  owners.
Recovering even a small batch can require several site visits and separate arrangements for
rooftop access. Studies in Amsterdam link the potential for urban solar generation to the built


                                                         1
Page 2
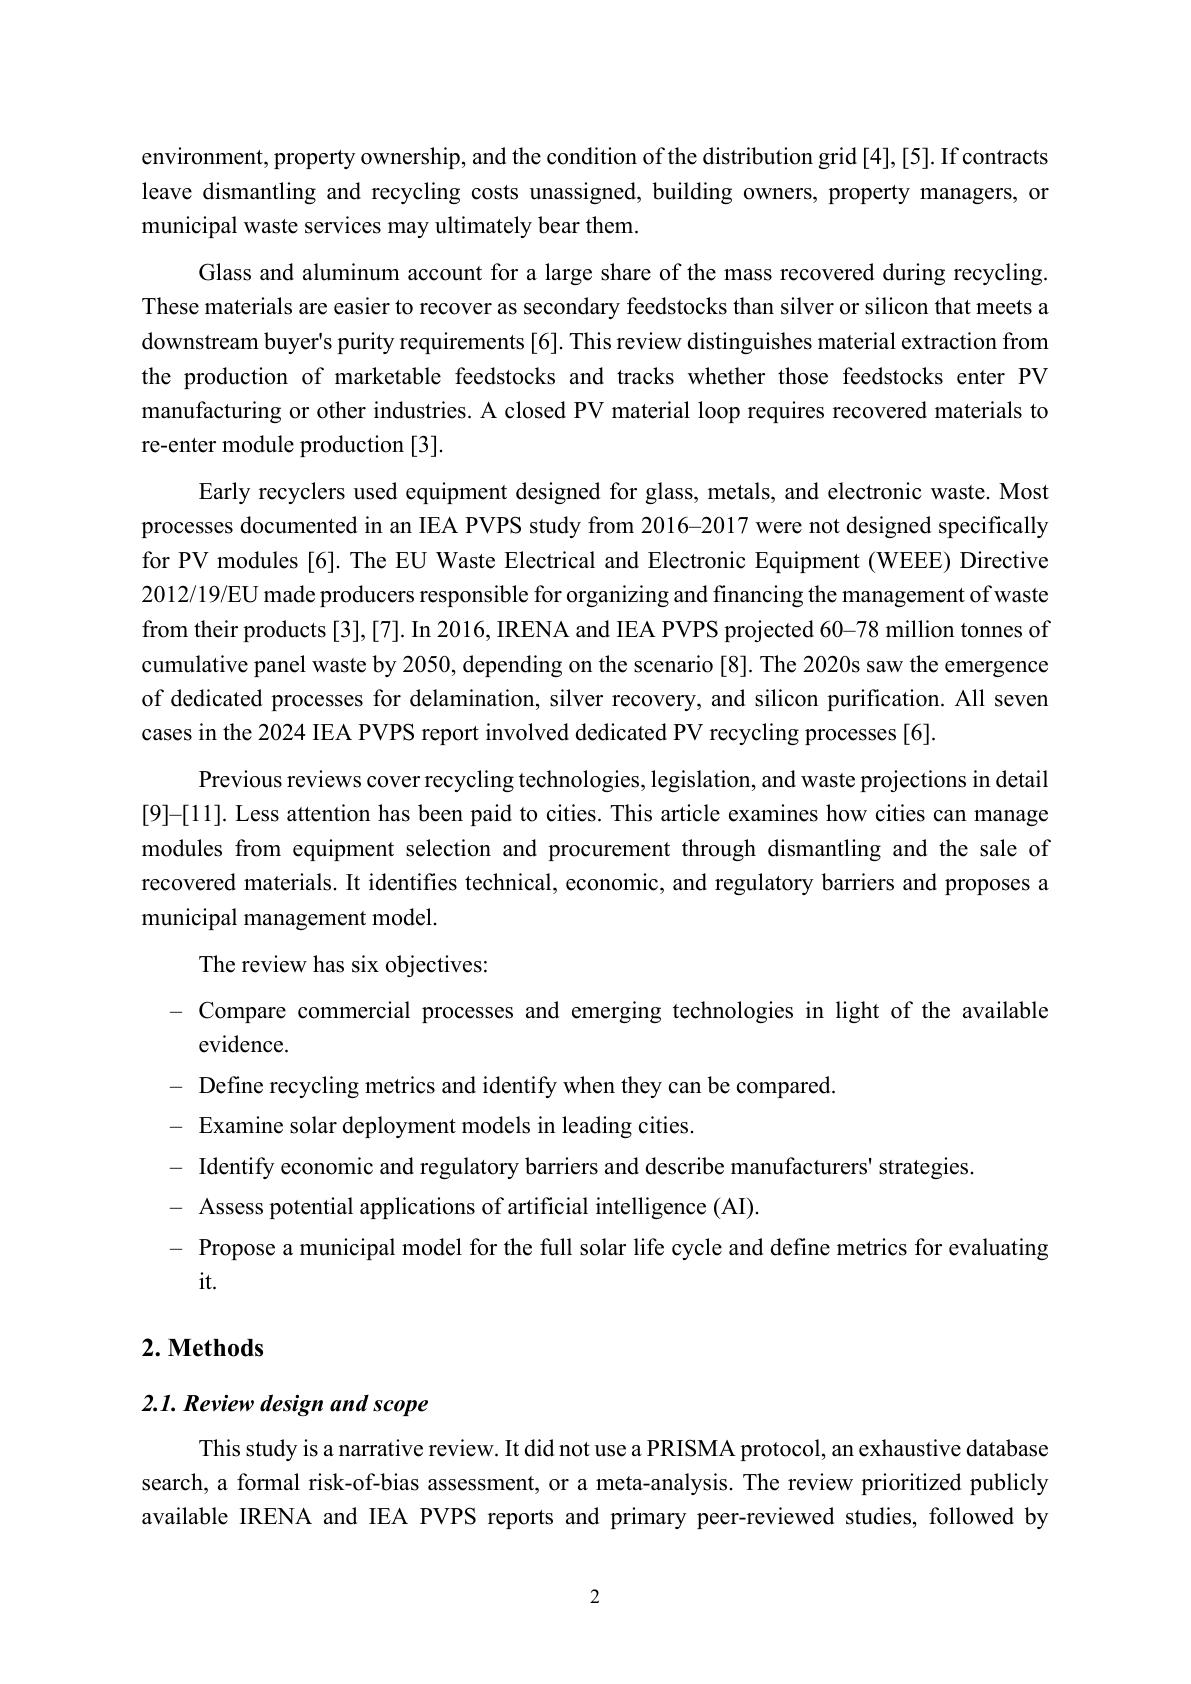
environment, property ownership, and the condition of the distribution grid [4], [5]. If contracts
leave  dismantling  and  recycling  costs  unassigned,  building  owners,  property  managers,  or
municipal waste services may ultimately bear them.
       Glass and aluminum account for a large share of the mass recovered during recycling.
These materials are easier to recover as secondary feedstocks than silver or silicon that meets a
downstream buyer's purity requirements [6]. This review distinguishes material extraction from
the  production  of  marketable  feedstocks  and  tracks  whether  those  feedstocks  enter  PV
manufacturing or other industries. A closed PV material loop requires recovered materials to
re-enter module production [3].
       Early recyclers used equipment designed for glass, metals, and electronic waste. Most
processes documented in an IEA PVPS study from 2016–2017 were not designed specifically
for PV modules [6]. The EU Waste Electrical and Electronic Equipment (WEEE) Directive
2012/19/EU made producers responsible for organizing and financing the management of waste
from their products [3], [7]. In 2016, IRENA and IEA PVPS projected 60–78 million tonnes of
cumulative panel waste by 2050, depending on the scenario [8]. The 2020s saw the emergence
of dedicated processes for delamination, silver recovery, and silicon purification. All seven
cases in the 2024 IEA PVPS report involved dedicated PV recycling processes [6].
       Previous reviews cover recycling technologies, legislation, and waste projections in detail
[9]–[11]. Less attention has been paid to cities. This article examines how cities can manage
modules  from  equipment  selection  and  procurement  through  dismantling  and  the  sale  of
recovered materials. It identifies technical, economic, and regulatory barriers and proposes a
municipal management model.
       The review has six objectives:
   –   Compare  commercial  processes  and  emerging  technologies  in  light  of  the  available
       evidence.
   –   Define recycling metrics and identify when they can be compared.
   –   Examine solar deployment models in leading cities.
   –   Identify economic and regulatory barriers and describe manufacturers' strategies.
   –   Assess potential applications of artificial intelligence (AI).
   –   Propose a municipal model for the full solar life cycle and define metrics for evaluating
       it.

2. Methods

2.1. Review design and scope
       This study is a narrative review. It did not use a PRISMA protocol, an exhaustive database
search, a formal risk-of-bias assessment, or a meta-analysis. The review prioritized publicly
available  IRENA  and  IEA  PVPS  reports  and  primary  peer-reviewed  studies,                     followed  by


                                                         2
Page 3
review   articles,   legislation,   and   publications   from   governments   and   companies.   Trade
publications helped establish facility start-up dates and when results were released. The review
covers information available through 9 November 2026.
       The  scope  is  limited  to  PV  modules  and  excludes  inverters,  batteries,  and  mounting
structures. The main focus is on crystalline silicon (c-Si). Thin-film modules (CdTe and CIGS)
and  perovskite  devices  are  examined  separately  because  their  composition  and  treatment
requirements differ [2], [10]. The cities were selected to illustrate different deployment models.

2.2. Evidence categories
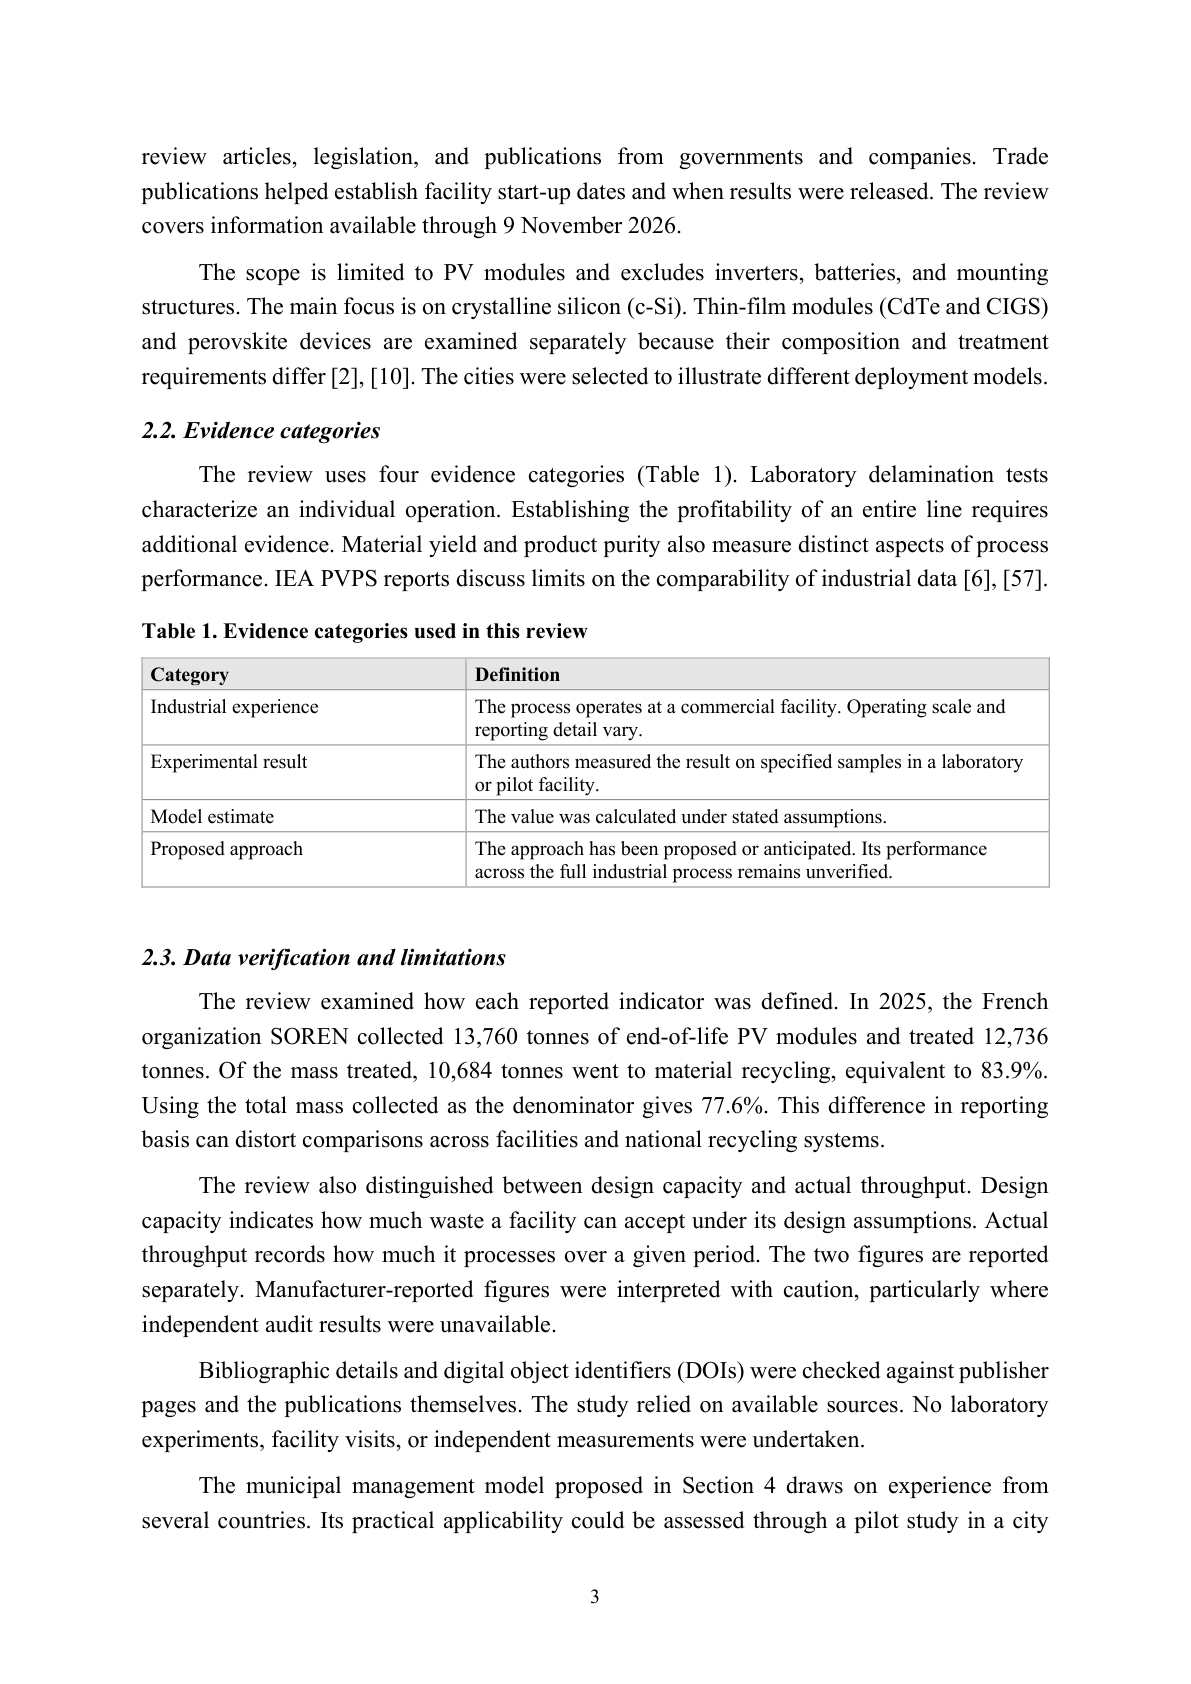
       The  review  uses  four  evidence  categories  (Table  1).  Laboratory  delamination  tests
characterize  an  individual  operation.  Establishing  the  profitability  of  an  entire  line  requires
additional evidence. Material yield and product purity also measure distinct aspects of process
performance. IEA PVPS reports discuss limits on the comparability of industrial data [6], [57].

Table 1. Evidence categories used in this review

 Category                                    Definition
 Industrial experience                       The process operates at a commercial facility. Operating scale and
                                             reporting detail vary.
 Experimental result                         The authors measured the result on specified samples in a laboratory
                                             or pilot facility.
 Model estimate                              The value was calculated under stated assumptions.
 Proposed approach                           The approach has been proposed or anticipated. Its performance
                                             across the full industrial process remains unverified.


2.3. Data verification and limitations
       The  review  examined  how  each  reported  indicator  was  defined.  In  2025,  the  French
organization SOREN collected 13,760 tonnes of end                     -of-life PV modules and treated 12,736
tonnes. Of the mass treated, 10,684 tonnes went to material recycling, equivalent to 83                             .9%.
Using the total mass collected as the denominator gives 77.6%. This difference in reporting
basis can distort comparisons across facilities and national recycling systems.
       The review also distinguished between design capacity and actual throughput. Design
capacity indicates how much waste a facility can accept under its design assumptions. Actual
throughput records how much it processes over a given period. The two figures a                             re reported
separately.  Manufacturer-reported  figures  were  interpreted  with  caution,  particularly  where
independent audit results were unavailable.

       Bibliographic details and digital object identifiers (DOIs) were checked against publisher
pages and the publications themselves. The study relied on available sources. No laboratory
experiments, facility visits, or independent measurements were undertaken                        .
       The  municipal  management  model  proposed  in  Section  4  draws  on  experience  from
several countries. Its practical applicability could be assessed through a pilot study in a city


                                                            3
Page 4
with a registry of PV installations and data on equipment condition, dismantling costs, and
module transport costs.

3. Results

3.1. Projected waste volumes and available statistics
       Under IRENA's 2026 scenario for limiting warming to 1.5 °C, cumulative end-of-life
panel mass could exceed 200 million tonnes by 2050, with annual waste exceeding 25 million
tonnes [2]. The estimate depends on deployment rates and module lifetimes. Comparing the
figure  directly  with  the  2016  projection  would  confound  projected  waste  growth  with
differences in scenario assumptions.
       Current  collection  volumes  remain  far  below  these  projections.  IEA  PVPS  reported
48,395 tonnes across 18 European countries in 2022. Data for the 2025 report were collected
mainly in 2024 [3]. Investors must time capacity expansions carefully to avoid maintaining
underused lines while waiting for waste volumes to rise.
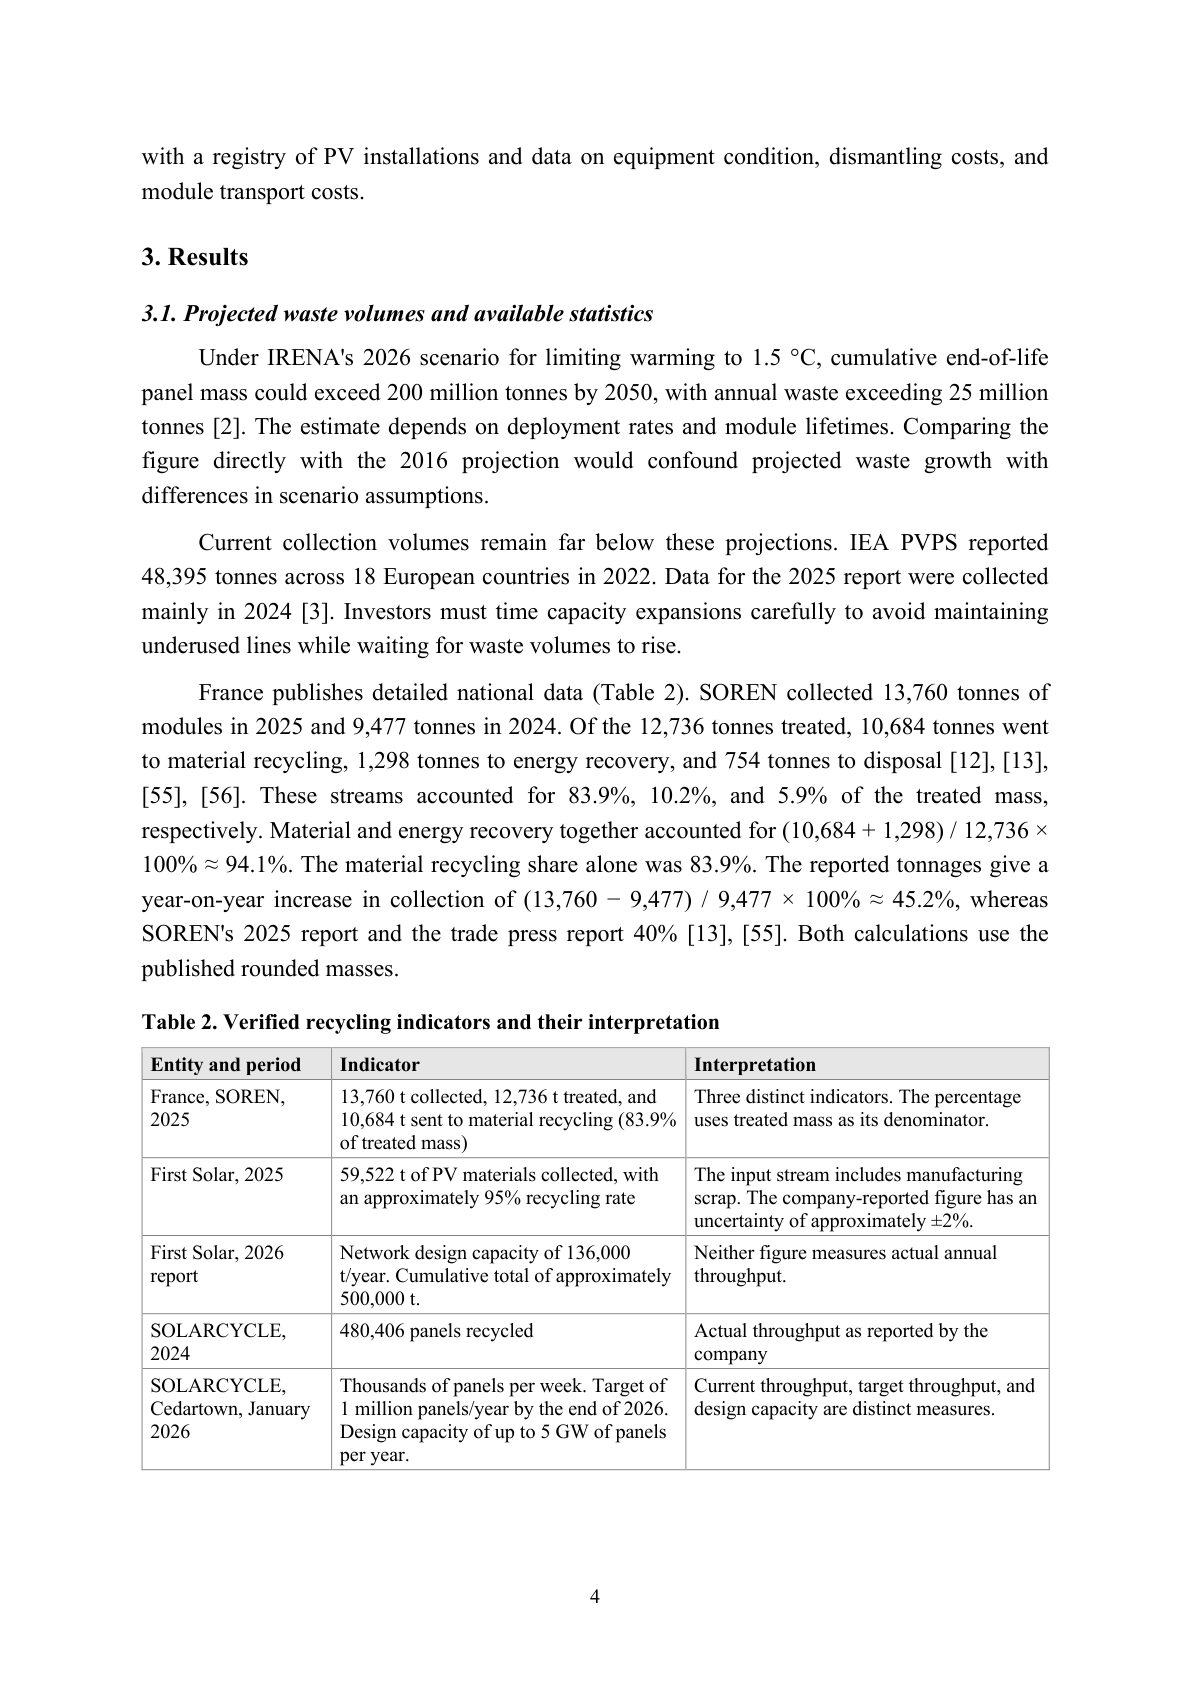
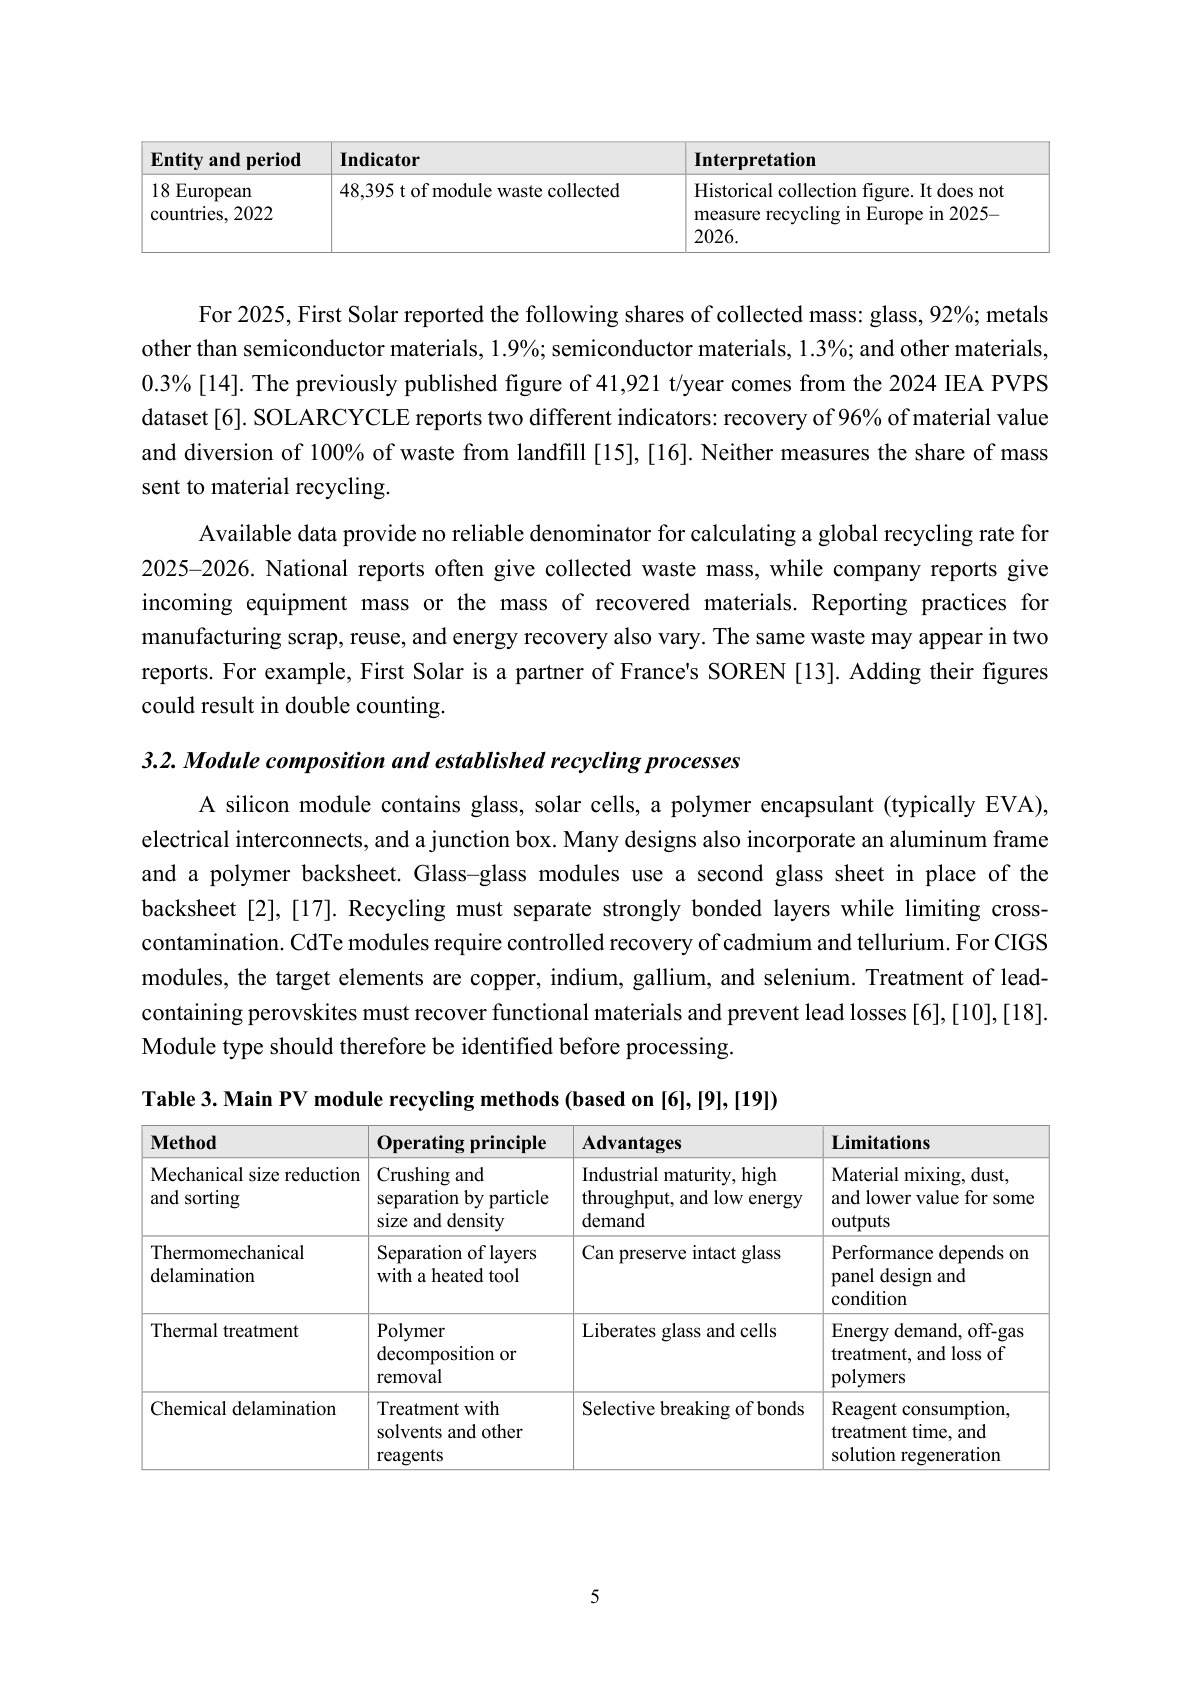
       France publishes detailed national data (Table 2). SOREN collected 13,760 tonnes of
modules in 2025 and 9,477 tonnes in 2024. Of the 12,736 tonnes treated, 10,684 tonnes went
to material recycling, 1,298 tonnes to energy recovery, and 754 tonnes to disposal [12], [13],
[55],  [56].  These  streams  accounted  for  83.9%,  10.2%,  and  5.9%  of  the  treated  mass,
respectively. Material and energy recovery together accounted for (10,684 + 1,298) / 12,736 ×
100% ≈ 94.1%. The material recycling share alone was 83.9%. The reported tonnages give a
year-on-year  increase  in  collection  of  (13,760  −  9,477)  /  9,477  ×  100%  ≈  45.2%,  whereas
SOREN's  2025  report  and  the  trade  press  report  40%  [13],  [55].  Both  calculations  use  the
published rounded masses.

Table 2. Verified recycling indicators and their interpretation

 Entity and period        Indicator                                       Interpretation
 France, SOREN,           13,760 t collected, 12,736 t treated, and       Three distinct indicators. The percentage
 2025                     10,684 t sent to material recycling (83.9%      uses treated mass as its denominator.
                          of treated mass)
 First Solar, 2025        59,522 t of PV materials collected, with        The input stream includes manufacturing
                          an approximately 95% recycling rate             scrap. The company-reported figure has an
                                                                          uncertainty of approximately ±2%.
 First Solar, 2026        Network design capacity of 136,000              Neither figure measures actual annual
 report                   t/year. Cumulative total of approximately       throughput.
                          500,000 t.
 SOLARCYCLE,              480,406 panels recycled                         Actual throughput as reported by the
 2024                                                                     company
 SOLARCYCLE,              Thousands of panels per week. Target of         Current throughput, target throughput, and
 Cedartown, January       1 million panels/year by the end of 2026.       design capacity are distinct measures.
 2026                     Design capacity of up to 5 GW of panels
                          per year.


                                                            4
Page 5
Entity and period         Indicator                                       Interpretation
 18 European               48,395 t of module waste collected              Historical collection figure. It does not
 countries, 2022                                                           measure recycling in Europe in 2025–
                                                                           2026.


       For 2025, First Solar reported the following shares of collected mass: glass, 92%; metals
other than semiconductor materials, 1.9%; semiconductor materials, 1.3%; and other materials,
0.3% [14]. The previously published figure of 41,921 t/year comes from t                          he 2024 IEA PVPS
dataset [6]. SOLARCYCLE reports two different indicators: recovery of 96% of material value
and diversion of 100% of waste from landfill [15], [16]. Neither measures the share of mass
sent to material recycling.
       Available data provide no reliable denominator for calculating a global recycling rate for
2025–2026.  National  reports  often  give  collected  waste  mass,  while  company  reports  give
incoming  equipment  mass  or  the  mass  of  recovered  materials.  Reporting  practic                            es  for
manufacturing scrap, reuse, and energy recovery also vary. The same waste may appear in two
reports. For example, First Solar is a partner of France's SOREN [13]. Adding their figures
could result in double counting.

3.2. Module composition and established recycling processes
       A  silicon  module  contains  glass,  solar  cells,  a  polymer  encapsulant  (typically  EVA),
electrical interconnects, and a junction box. Many designs also incorporate an aluminum frame
and  a  polymer  backsheet.  Glass–glass  modules  use  a  second  glass  sheet  in  plac                       e  of  the
backsheet  [2],  [17].  Recycling  must  separate  strongly  bonded  layers  while  limiting  cross                        -
contamination. CdTe modules require controlled recovery of cadmium and tellurium. For CIGS
modules, the target elements are copper, indium, gallium, and selen                        ium. Treatment of lead-
containing perovskites must recover functional materials and prevent lead losses [6], [10], [18].
Module type should therefore be identified before processing.

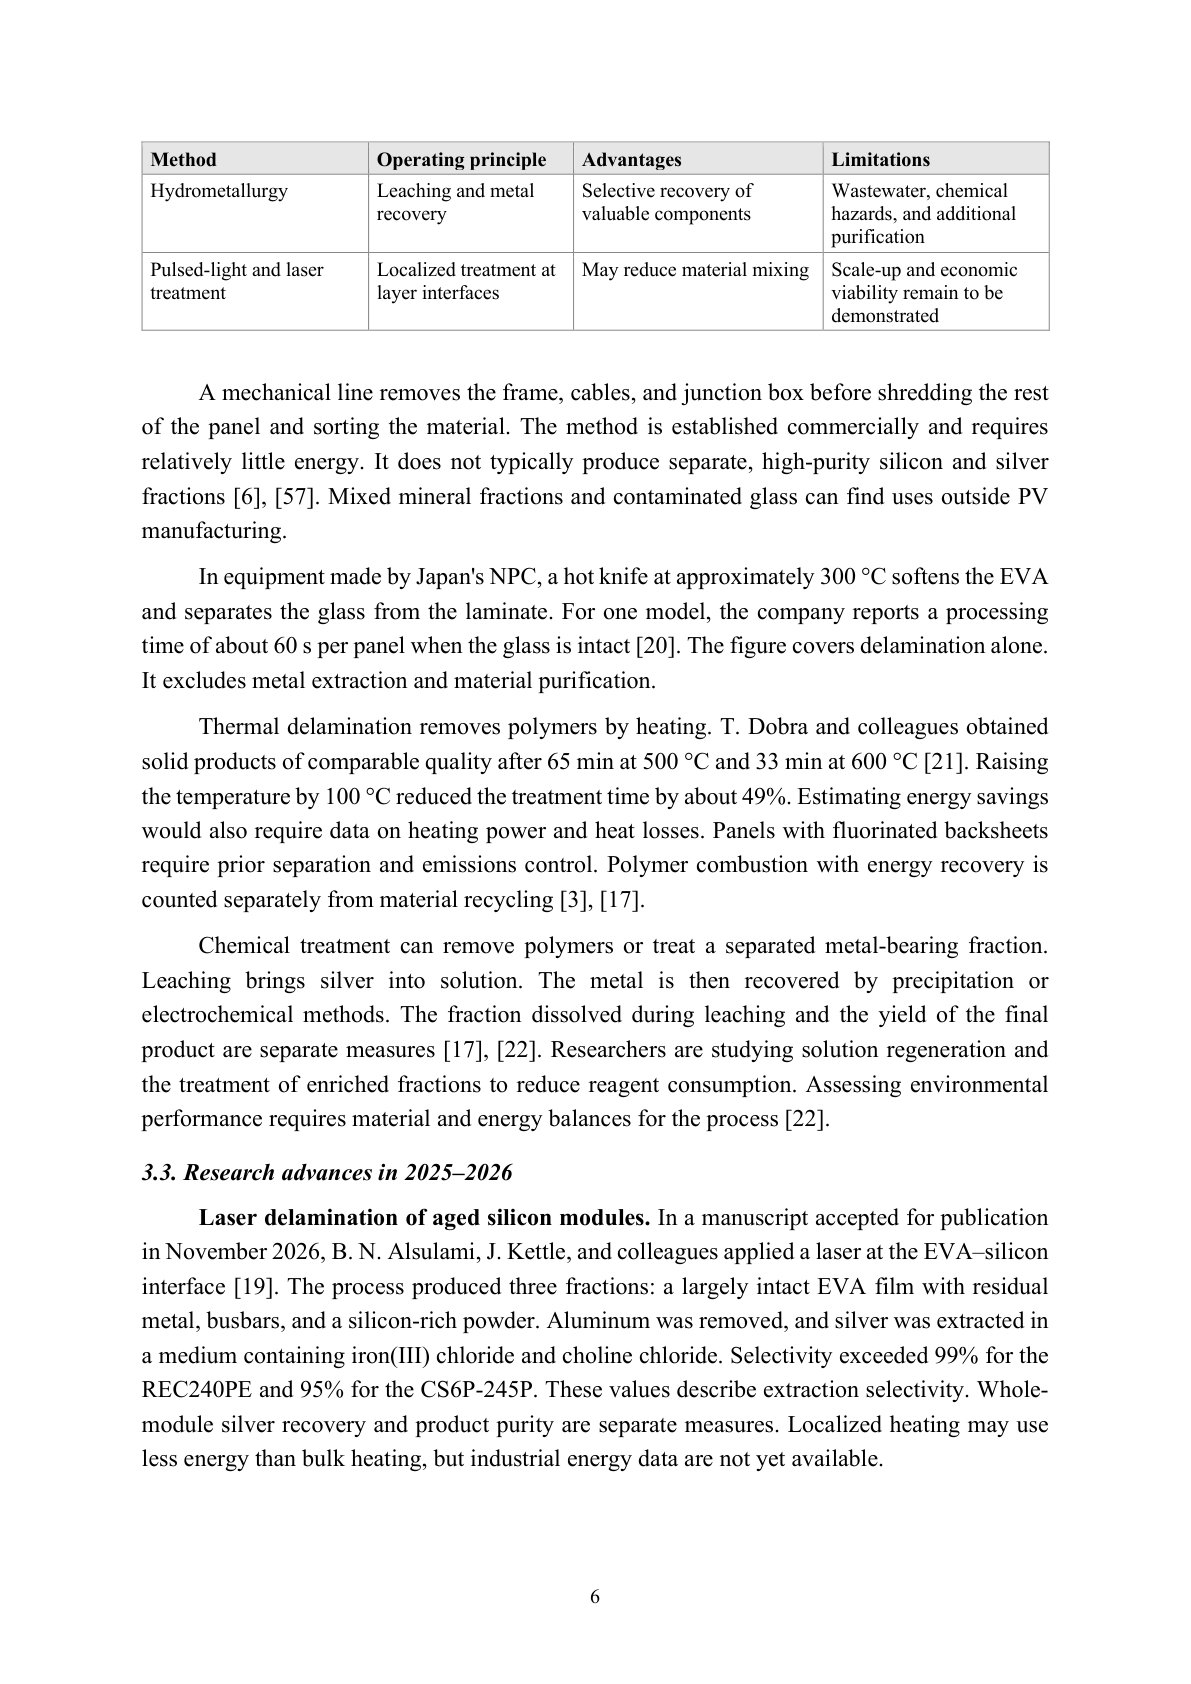
Table 3. Main PV module recycling methods (based on [6], [9], [19])

 Method                         Operating principle         Advantages                        Limitations
 Mechanical size reduction      Crushing and                Industrial maturity, high         Material mixing, dust,
 and sorting                    separation by particle      throughput, and low energy        and lower value for some
                                size and density            demand                            outputs
 Thermomechanical               Separation of layers        Can preserve intact glass         Performance depends on
 delamination                   with a heated tool                                            panel design and
                                                                                              condition
 Thermal treatment              Polymer                     Liberates glass and cells         Energy demand, off-gas
                                decomposition or                                              treatment, and loss of
                                removal                                                       polymers
 Chemical delamination          Treatment with              Selective breaking of bonds       Reagent consumption,
                                solvents and other                                            treatment time, and
                                reagents                                                      solution regeneration


                                                             5
Page 6
Method                        Operating principle        Advantages                       Limitations
 Hydrometallurgy               Leaching and metal         Selective recovery of            Wastewater, chemical
                               recovery                   valuable components              hazards, and additional
                                                                                           purification
 Pulsed-light and laser        Localized treatment at     May reduce material mixing       Scale-up and economic
 treatment                     layer interfaces                                            viability remain to be
                                                                                           demonstrated

       A mechanical line removes the frame, cables, and junction box before shredding the rest
of the panel and sorting the material. The method is established commercially and requires
relatively little energy. It does not typically produce separate, high                 -purity silicon and silver
fractions [6], [57]. Mixed mineral fractions and contaminated glass can find uses outside PV
manufacturing.

       In equipment made by Japan's NPC, a hot knife at approximately 300 °C softens the EVA
and separates the glass from the laminate. For one model, the company reports a processing
time of about 60 s per panel when the glass is intact [20]. The figure covers d                 elamination alone.
It excludes metal extraction and material purification.

       Thermal delamination removes polymers by heating. T. Dobra and colleagues obtained
solid products of comparable quality after 65 min at 500 °C and 33 min at 600 °C [21]. Raising
the temperature by 100 °C reduced the treatment time by about 49%. Estimating                       energy savings
would also require data on heating power and heat losses. Panels with fluorinated backsheets
require prior separation and emissions control. Polymer combustion with energy recovery is
counted separately from material recycling [3], [17].
       Chemical  treatment  can  remove  polymers  or  treat  a  separated  metal                -bearing  fraction.
Leaching  brings  silver  into  solution.  The  metal  is  then  recovered  by  precipitation  or
electrochemical  methods.  The  fraction  dissolved  during  leaching  and  the  yield  of  the  f                inal
product are separate measures [17], [22]. Researchers are studying solution regeneration and
the treatment of enriched fractions to reduce reagent consumption. Assessing environmental
performance requires material and energy balances for the process [                  22].

3.3. Research advances in 2025          –2026
       Laser delamination of aged silicon modules.                  In a manuscript accepted for publication
in November 2026, B. N. Alsulami, J. Kettle, and colleagues applied a laser at the EVA                       –silicon
interface [19]. The process produced three fractions: a largely intact EVA film with residual
metal, busbars, and a silicon-rich powder. Aluminum was removed, and silver was extracted in
a medium containing iron(III) chloride and choline chloride. Selectivity exceeded 99% for the
REC240PE and 95% for the CS6P-245P. These values describe extraction selectivity. Whole                               -
module silver recovery and product purity are separate measures. Localized heating may use
less energy than bulk heating, but industrial energy data are not yet available.


                                                           6
Page 7
Layer-by-layer   abrasive   separation.               In   the   EVERPV   project,   F.   Coustier   and
colleagues at CEA used abrasive belts to remove the rear layers while keeping the glass intact
[17]. They collected the backsheet separately from the encapsulant, cells, and interconnects.
Tests covered more than 400 end-of-life modules from four manufacturers. At a belt speed of
2.3 m/min, the pilot line processed about one panel per minute, excluding subsequent powder
treatment. The method was described for intact glass–backsheet modules less than 1,300 mm
wide. Laboratory tests yielded silicon at 99.9% purity and a silver-bearing product containing
about 90% silver. Recovery yields were around 98% for both materials. The industrial silver
recovery  estimate  of  99.9%  remains  a  projection.  Polymer  fractions  also  require  further
preparation before shipment to a recycler.
       Aqueous perovskite recycling. X. Xiao and colleagues dissolved the perovskite layer in
a heated aqueous medium with additives. Crystals precipitated as the solution cooled [18]. The
process  recovered  99.0  ±  0.4%  of  the  perovskite  material  by  mass.  Devices  made  from
recovered material achieved a mean power conversion efficiency of 21.9 ± 1.1%, compared
with  21.8  ±  0.8%  after  five  degradation  and  recycling  cycles.  The  means  differ  by  0.1
percentage points. Further statistical information would be needed to assess the significance of
that  difference.  The  tests  used  research  devices,  including  devices  subjected  to  accelerated
degradation.  Commercial  readiness  for  full-size  perovskite  and  tandem  modules  remains
unproven.
       Use  of  recovered  silicon  in  batteries.          Y.  Zhao  and  colleagues  (3  November  2026)
blended recovered silicon with graphite to make lithium-ion battery anodes. The mixture was
heat-treated at 800 °C in nitrogen [23]. After 100 cycles at 0.5 A/g, the composite with a Si:C
mass ratio of 2:8 retained 47.5% of its capacity, compared with 12.8% for the untreated waste
silicon.  The  difference  was  34.7  percentage  points.  Even  the  best  sample  lost  52.5%  of  its
capacity. The composite outperformed the control, but the test did not establish durability for
commercial use.

3.4. Industry participants and manufacturer strategies
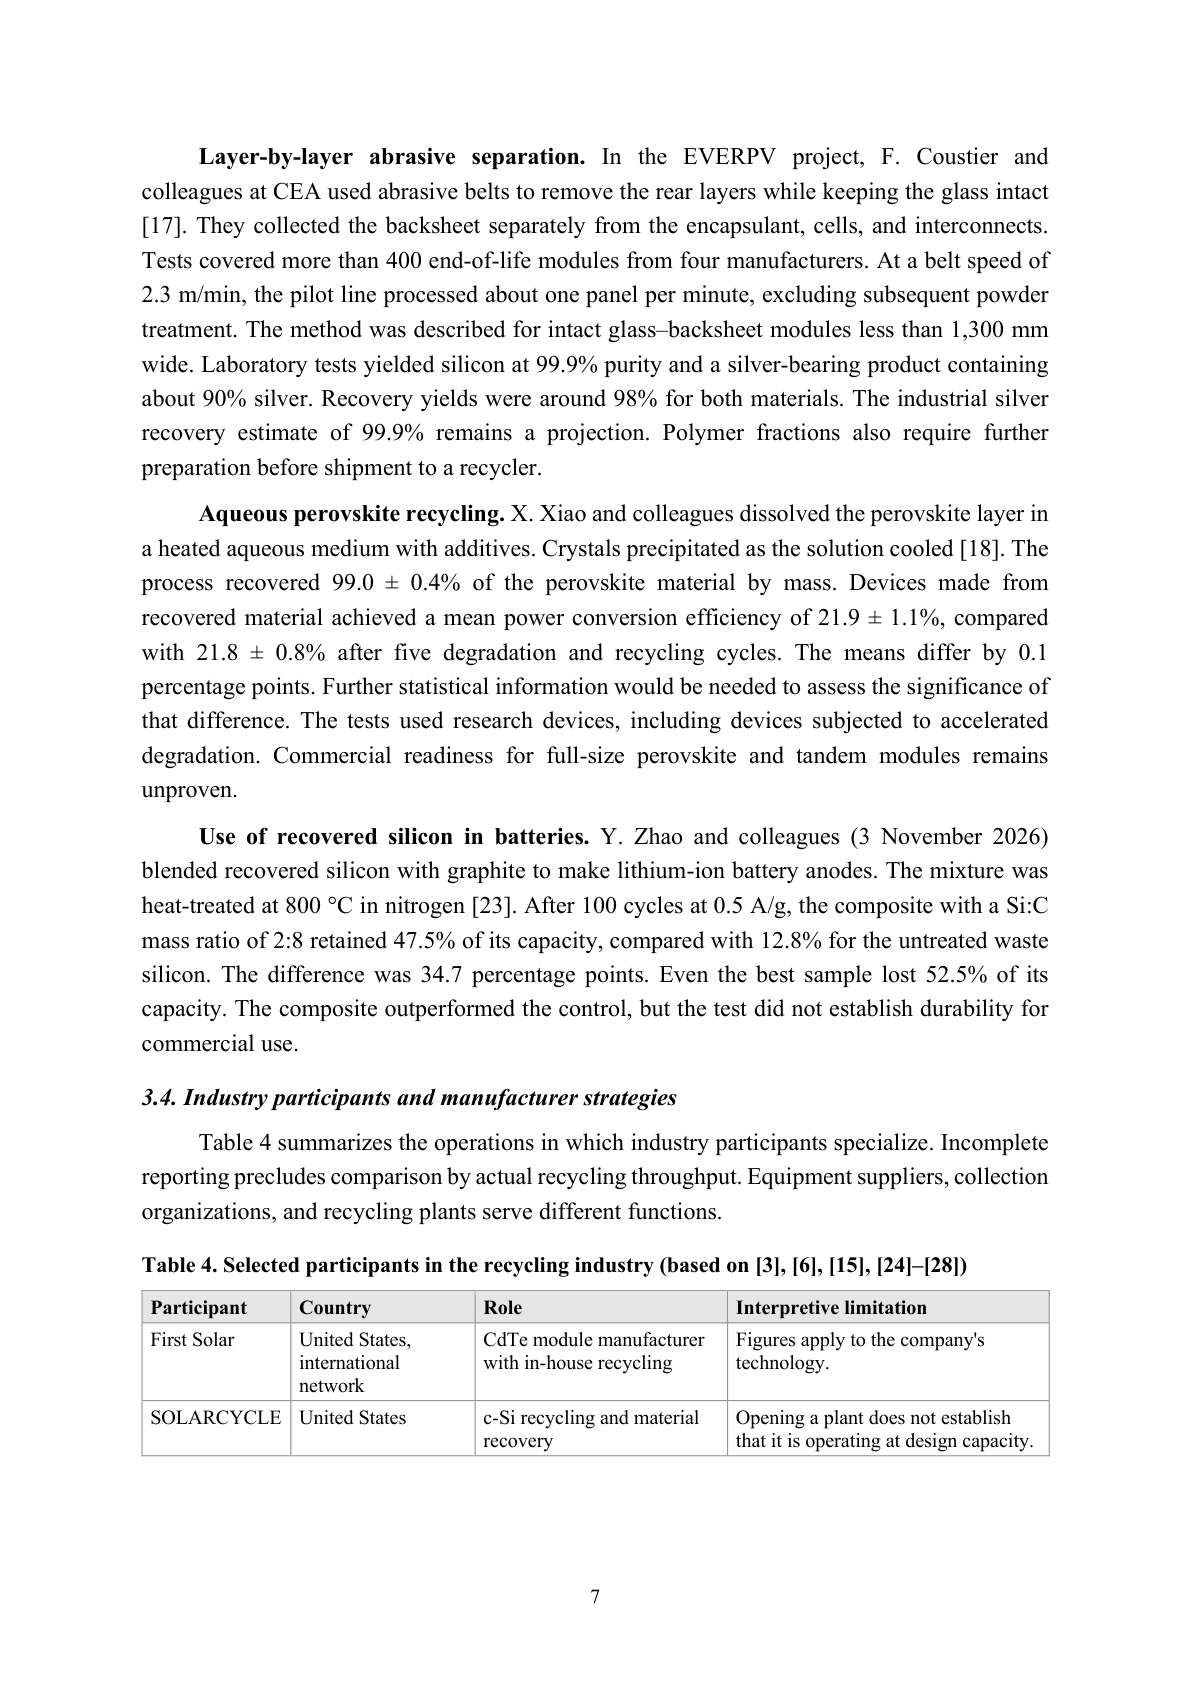
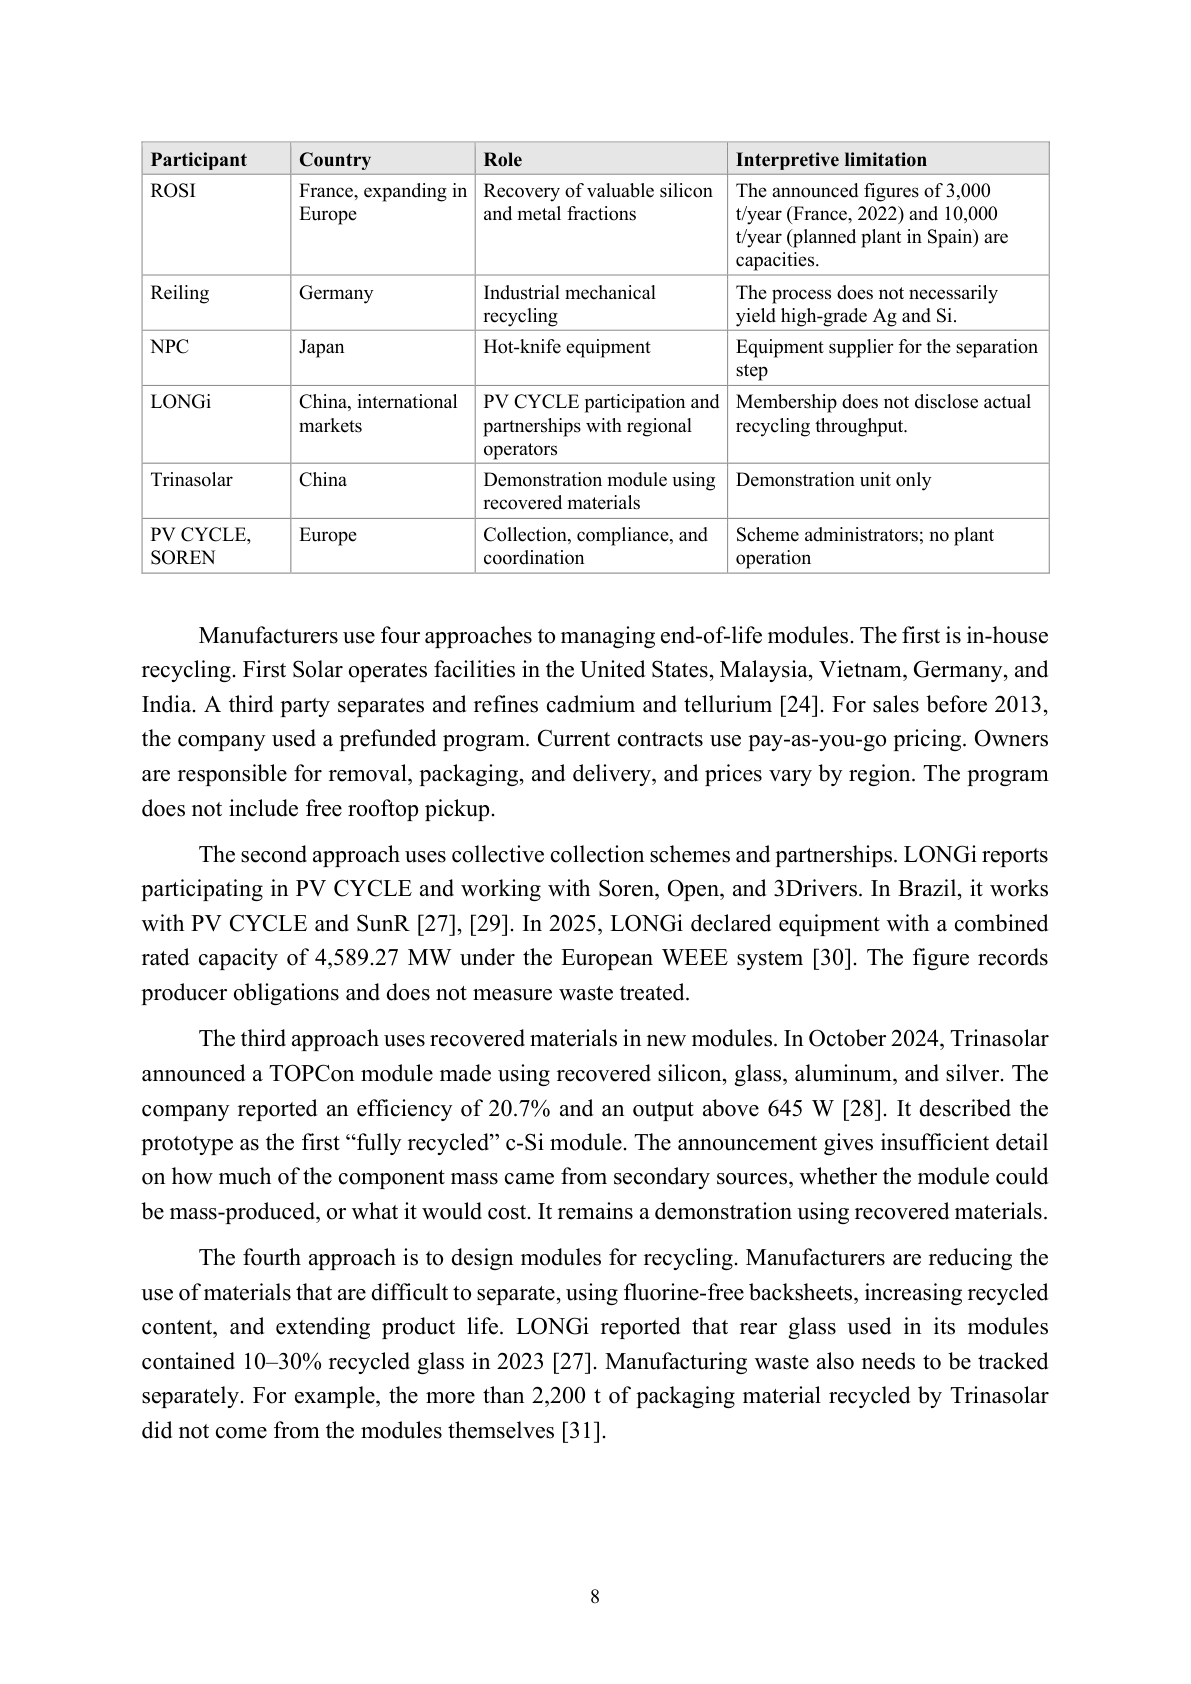
       Table 4 summarizes the operations in which industry participants specialize. Incomplete
reporting precludes comparison by actual recycling throughput. Equipment suppliers, collection
organizations, and recycling plants serve different functions.

Table 4. Selected participants in the recycling industry (based on [3], [6], [15], [24]–[28])

 Participant        Country                  Role                             Interpretive limitation
 First Solar        United States,           CdTe module manufacturer         Figures apply to the company's
                    international            with in-house recycling          technology.
                    network
 SOLARCYCLE         United States            c-Si recycling and material      Opening a plant does not establish
                                             recovery                         that it is operating at design capacity.


                                                           7
Page 8
Participant        Country                  Role                             Interpretive limitation
 ROSI               France, expanding in     Recovery of valuable silicon     The announced figures of 3,000
                    Europe                   and metal fractions              t/year (France, 2022) and 10,000
                                                                              t/year (planned plant in Spain) are
                                                                              capacities.
 Reiling            Germany                  Industrial mechanical            The process does not necessarily
                                             recycling                        yield high-grade Ag and Si.
 NPC                Japan                    Hot-knife equipment              Equipment supplier for the separation
                                                                              step
 LONGi              China, international     PV CYCLE participation and       Membership does not disclose actual
                    markets                  partnerships with regional       recycling throughput.
                                             operators
 Trinasolar         China                    Demonstration module using       Demonstration unit only
                                             recovered materials
 PV CYCLE,          Europe                   Collection, compliance, and      Scheme administrators; no plant
 SOREN                                       coordination                     operation

       Manufacturers use four approaches to managing end                 -of-life modules. The first is in-house
recycling. First Solar operates facilities in the United States, Malaysia, Vietnam, Germany, and
India. A third party separates and refines cadmium and tellurium [24].                     For sales before 2013,
the company used a prefunded program. Current contracts use pay                      -as-you-go pricing. Owners
are responsible for removal, packaging, and delivery, and prices vary by region. The program
does not include free rooftop pickup.
       The second approach uses collective collection schemes and partnerships. LONGi reports
participating in PV CYCLE and working with Soren, Open, and 3Drivers. In Brazil, it works
with PV CYCLE and SunR [27], [29]. In 2025, LONGi declared equipment with a combined
rated capacity of 4,589.27 MW under the European WEEE system [30]. The figure records
producer obligations and does not measure waste treated.

       The third approach uses recovered materials in new modules. In October 2024, Trinasolar
announced a TOPCon module made using recovered silicon, glass, aluminum, and silver. The
company reported an efficiency of 20.7% and an output above 645 W [28]. It described the
prototype as the first “fully recycled” c-Si module. The announcement gives insufficient detail
on how much of the component mass came from secondary sources, whether the module could
be mass-produced, or what it would cost. It remains a demonstration using recovered materials.
       The fourth approach is to design modules for recycling. Manufacturers are reducing the
use of materials that are difficult to separate, using fluorine-free backsheets, increasing recycled
content,  and  extending  product  life.  LONGi  reported  that  rear  glass                 used  in  its  modules
contained 10–30% recycled glass in 2023 [27]. Manufacturing waste also needs to be tracked
separately. For example, the more than 2,200 t of packaging material recycled by Trinasolar
did not come from the modules themselves [31].


                                                           8
Page 9
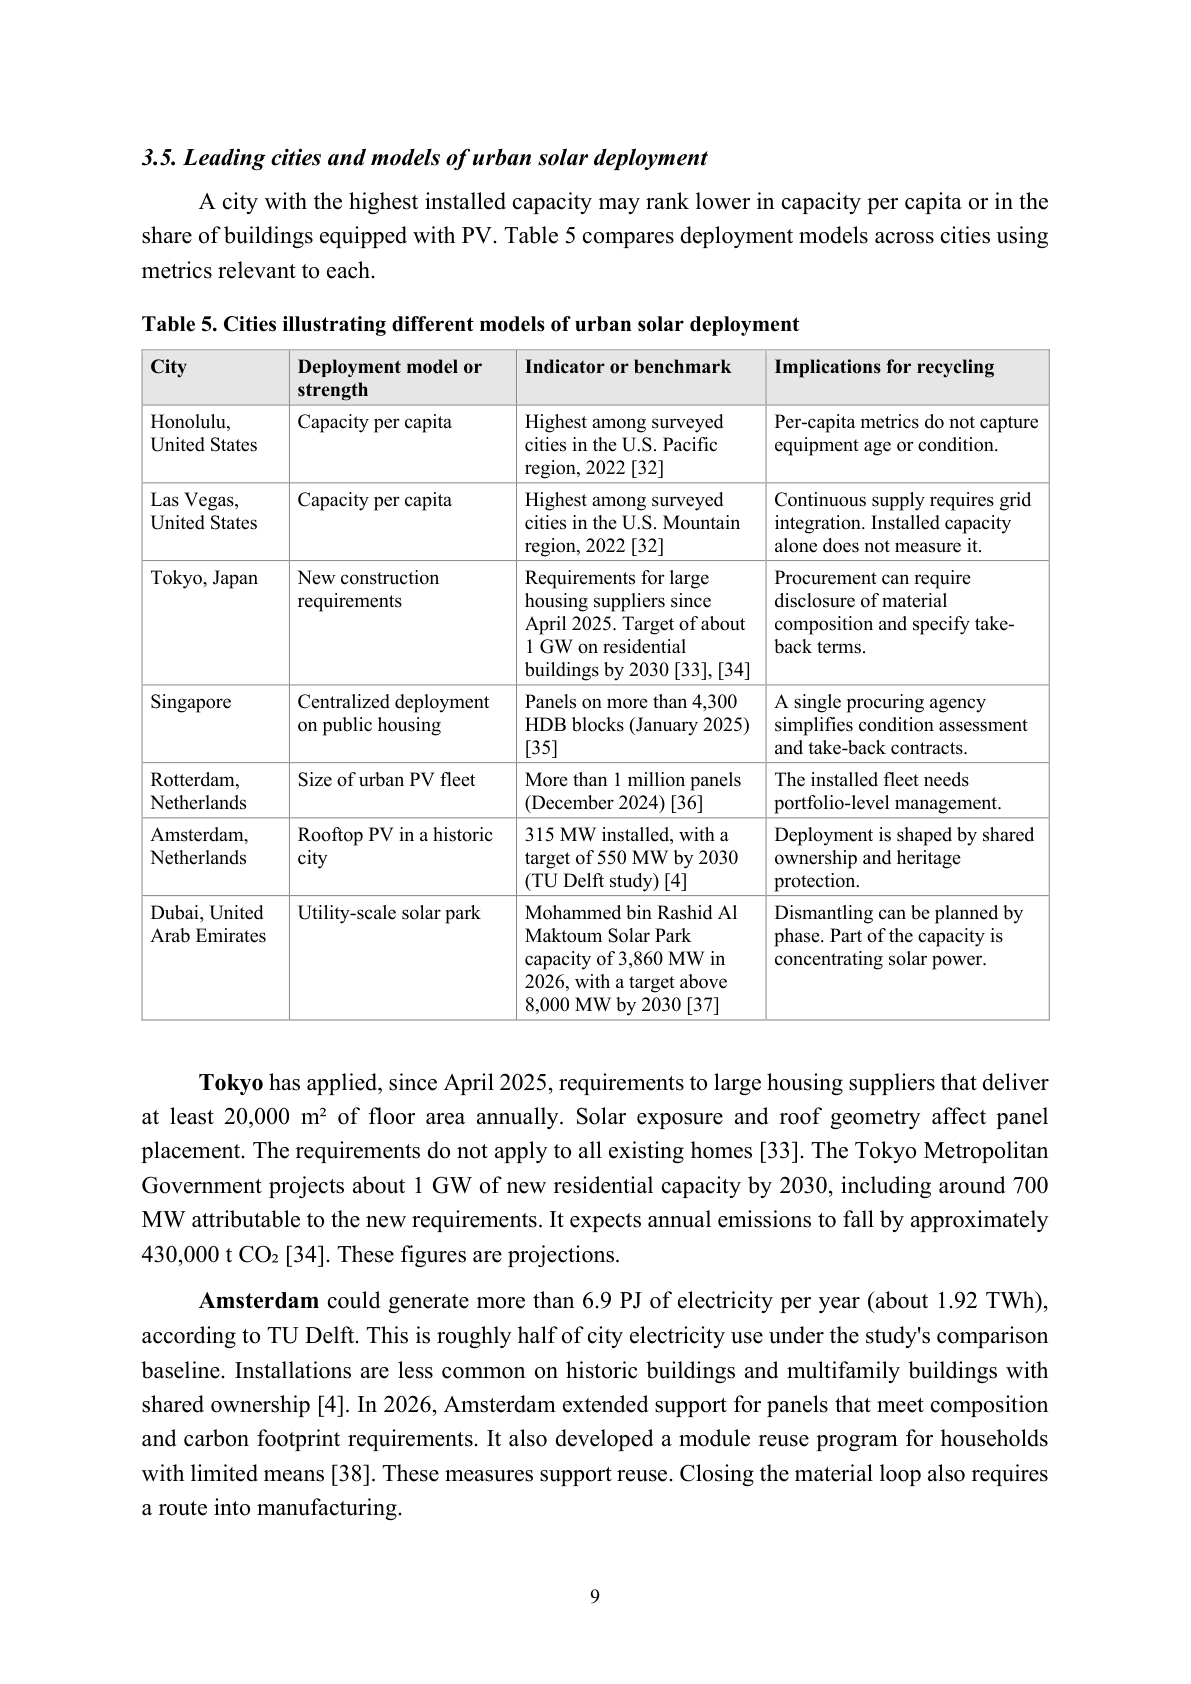
3.5. Leading cities and models of urban solar deployment
       A city with the highest installed capacity may rank lower in capacity per capita or in the
share of buildings equipped with PV. Table 5 compares deployment models across cities using
metrics relevant to each.

Table 5. Cities illustrating different models of urban solar deployment

 City                Deployment model or             Indicator or benchmark             Implications for recycling
                     strength
 Honolulu,           Capacity per capita             Highest among surveyed             Per-capita metrics do not capture
 United States                                       cities in the U.S. Pacific         equipment age or condition.
                                                     region, 2022 [32]
 Las Vegas,          Capacity per capita             Highest among surveyed             Continuous supply requires grid
 United States                                       cities in the U.S. Mountain        integration. Installed capacity
                                                     region, 2022 [32]                  alone does not measure it.
 Tokyo, Japan        New construction                Requirements for large             Procurement can require
                     requirements                    housing suppliers since            disclosure of material
                                                     April 2025. Target of about        composition and specify take-
                                                     1 GW on residential                back terms.
                                                     buildings by 2030 [33], [34]
 Singapore           Centralized deployment          Panels on more than 4,300          A single procuring agency
                     on public housing               HDB blocks (January 2025)          simplifies condition assessment
                                                     [35]                               and take-back contracts.
 Rotterdam,          Size of urban PV fleet          More than 1 million panels         The installed fleet needs
 Netherlands                                         (December 2024) [36]               portfolio-level management.
 Amsterdam,          Rooftop PV in a historic        315 MW installed, with a           Deployment is shaped by shared
 Netherlands         city                            target of 550 MW by 2030           ownership and heritage
                                                     (TU Delft study) [4]               protection.
 Dubai, United       Utility-scale solar park        Mohammed bin Rashid Al             Dismantling can be planned by
 Arab Emirates                                       Maktoum Solar Park                 phase. Part of the capacity is
                                                     capacity of 3,860 MW in            concentrating solar power.
                                                     2026, with a target above
                                                     8,000 MW by 2030 [37]

       Tokyo has applied, since April 2025, requirements to large housing suppliers that deliver
at  least  20,000  m²  of  floor  area  annually.  Solar  exposure  and  roof  geometry  affect  panel
placement. The requirements do not apply to all existing homes [33]. The Tokyo Met                                ropolitan
Government projects about 1 GW of new residential capacity by 2030, including around 700
MW attributable to the new requirements. It expects annual emissions to fall by approximately
430,000 t CO₂ [34]. These figures are projections.
       Amsterdam could generate more than 6.9 PJ of electricity per year (about 1.92 TWh),
according to TU Delft. This is roughly half of city electricity use under the study's comparison
baseline. Installations are less common on historic buildings and multifamily buildi                               ngs with
shared ownership [4]. In 2026, Amsterdam extended support for panels that meet composition
and carbon footprint requirements. It also developed a module reuse program for households
with limited means [38]. These measures support reuse. Closing th                        e material loop also requires
a route into manufacturing.


                                                              9
Page 10
Rotterdam reported in December 2024 more than one million installed panels and the
largest solar capacity among the four largest Dutch cities [36]. Managing an installed base of
that size requires data on module age and condition as well as scheduled roof repairs.
       Singapore installs panels on public housing through the Housing & Development Board
(HDB). As of 31 March 2024, 325 MWp was in operation. Eight tenders awarded about 455
MWp, and the 2030 target is 540 MWp [39], [40]. The electricity powers lifts, lighting, pumps,
and other common services. Surplus electricity is exported to the grid. Individual apartments
still rely on the grid [41]. Solar-ready designs reserve space for panels, supports, and electrical
infrastructure from the outset [40].
       Dubai illustrates the utility-scale solar park model. The 950 MW fourth phase of the park
includes 700 MW of concentrating solar power and 250 MW of PV [37]. PV accounts for 250
/ 950 × 100% ≈ 26.3% of capacity in this phase. Waste projections for PV modules sh                               ould
therefore use the 250 MW PV capacity.
       For  future  dismantling,  the  cases  illustrate  three  organizational  models.  In  distributed
rooftop   systems,   the   priorities   are   identifying   owners,   arranging   building   access,   and
consolidating small batches. Centrally managed installation programs can standar                        dize service
and take-back terms. Large parks require phase              -by-phase replacement schedules and separate
collection for different module technologies. The classification was developed for this review
and is not an industry standard.

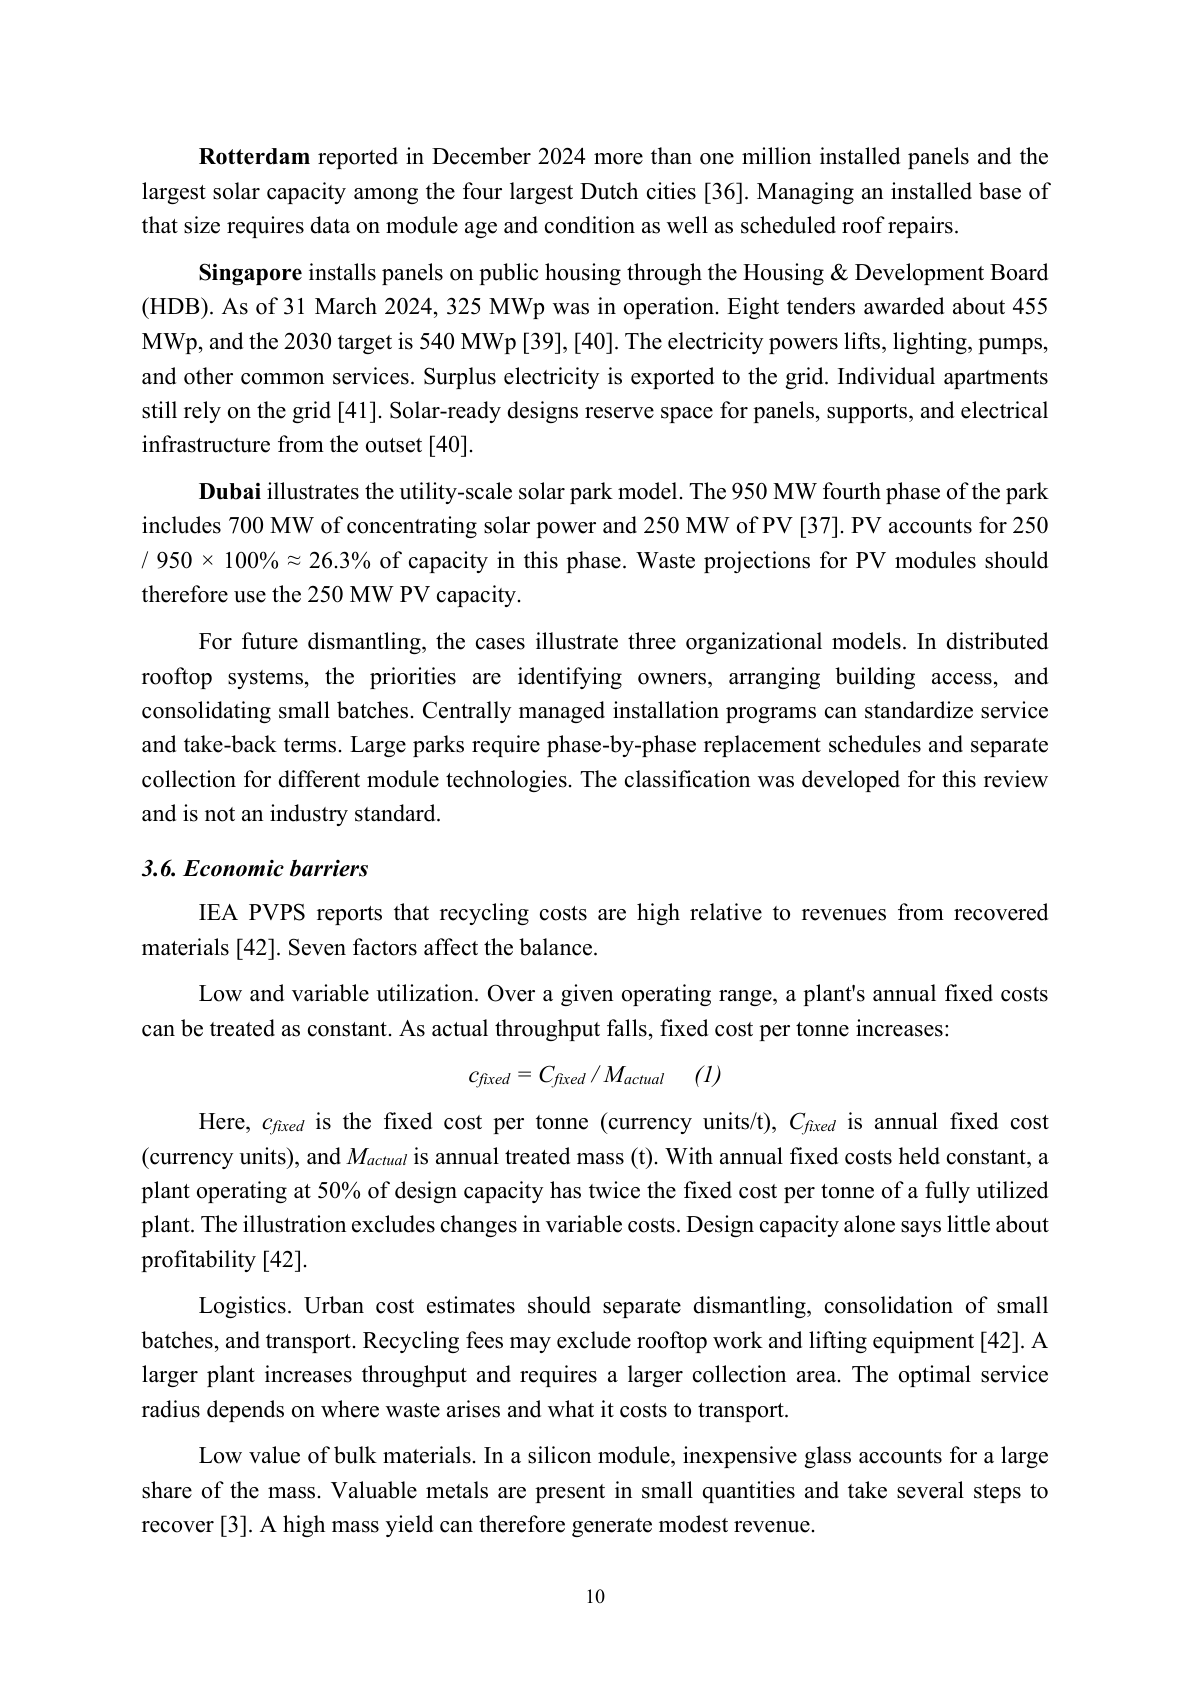
3.6. Economic barriers
       IEA  PVPS  reports  that  recycling  costs  are  high  relative  to  revenues  from  recovered
materials [42]. Seven factors affect the balance.
       Low and variable utilization. Over a given operating range, a plant's annual fixed costs
can be treated as constant. As actual throughput falls, fixed cost per tonne increases:

                                           cfixed = Cfixed / Mactual     (1)
       Here,   cfixed is  the  fixed  cost  per  tonne  (currency  units/t), Cfixed          is  annual  fixed  cost
(currency units), and Mactual is annual treated mass (t). With annual fixed costs held constant, a
plant operating at 50% of design capacity has twice the fixed cost per tonne of a fully utilized
plant. The illustration excludes changes in variable costs. Design capacity alone says little about
profitability [42].
       Logistics.  Urban  cost  estimates  should  separate  dismantling,  consolidation  of  small
batches, and transport. Recycling fees may exclude rooftop work and lifting equipment [42]. A
larger  plant  increases  throughput  and  requires  a  larger  collection  area.  The  optimal  service
radius depends on where waste arises and what it costs to transport.
       Low value of bulk materials. In a silicon module, inexpensive glass accounts for a large
share of the mass. Valuable metals are present in small quantities and take several steps to
recover [3]. A high mass yield can therefore generate modest revenue.


                                                          10
Page 11
Advanced treatment costs. Chemical purification improves product quality and adds cost
[43]. The step pays for itself when incremental revenue exceeds incremental cost. Otherwise, it
requires separate funding.
       Markets and impurities. Even a high silicon content may fall short of the specifications
for new solar cells [42]. Before purchasing equipment, recyclers need to establish prospective
customers' requirements for composition and purity.
       Weak incentives to recover valuable components. Heavy fractions can contribute most of
the  mass  needed  to  meet  WEEE  targets.  IEA  PVPS  notes  that  such  targets  provide  limited
incentive to invest in costly recovery steps for minor fractions [43].
       Changes in module composition. Using less silver in manufacturing reduces the potential
recycling revenue per module [2], [43]. Long              -term financial assessments should account for
future feedstock composition as well as metal prices.

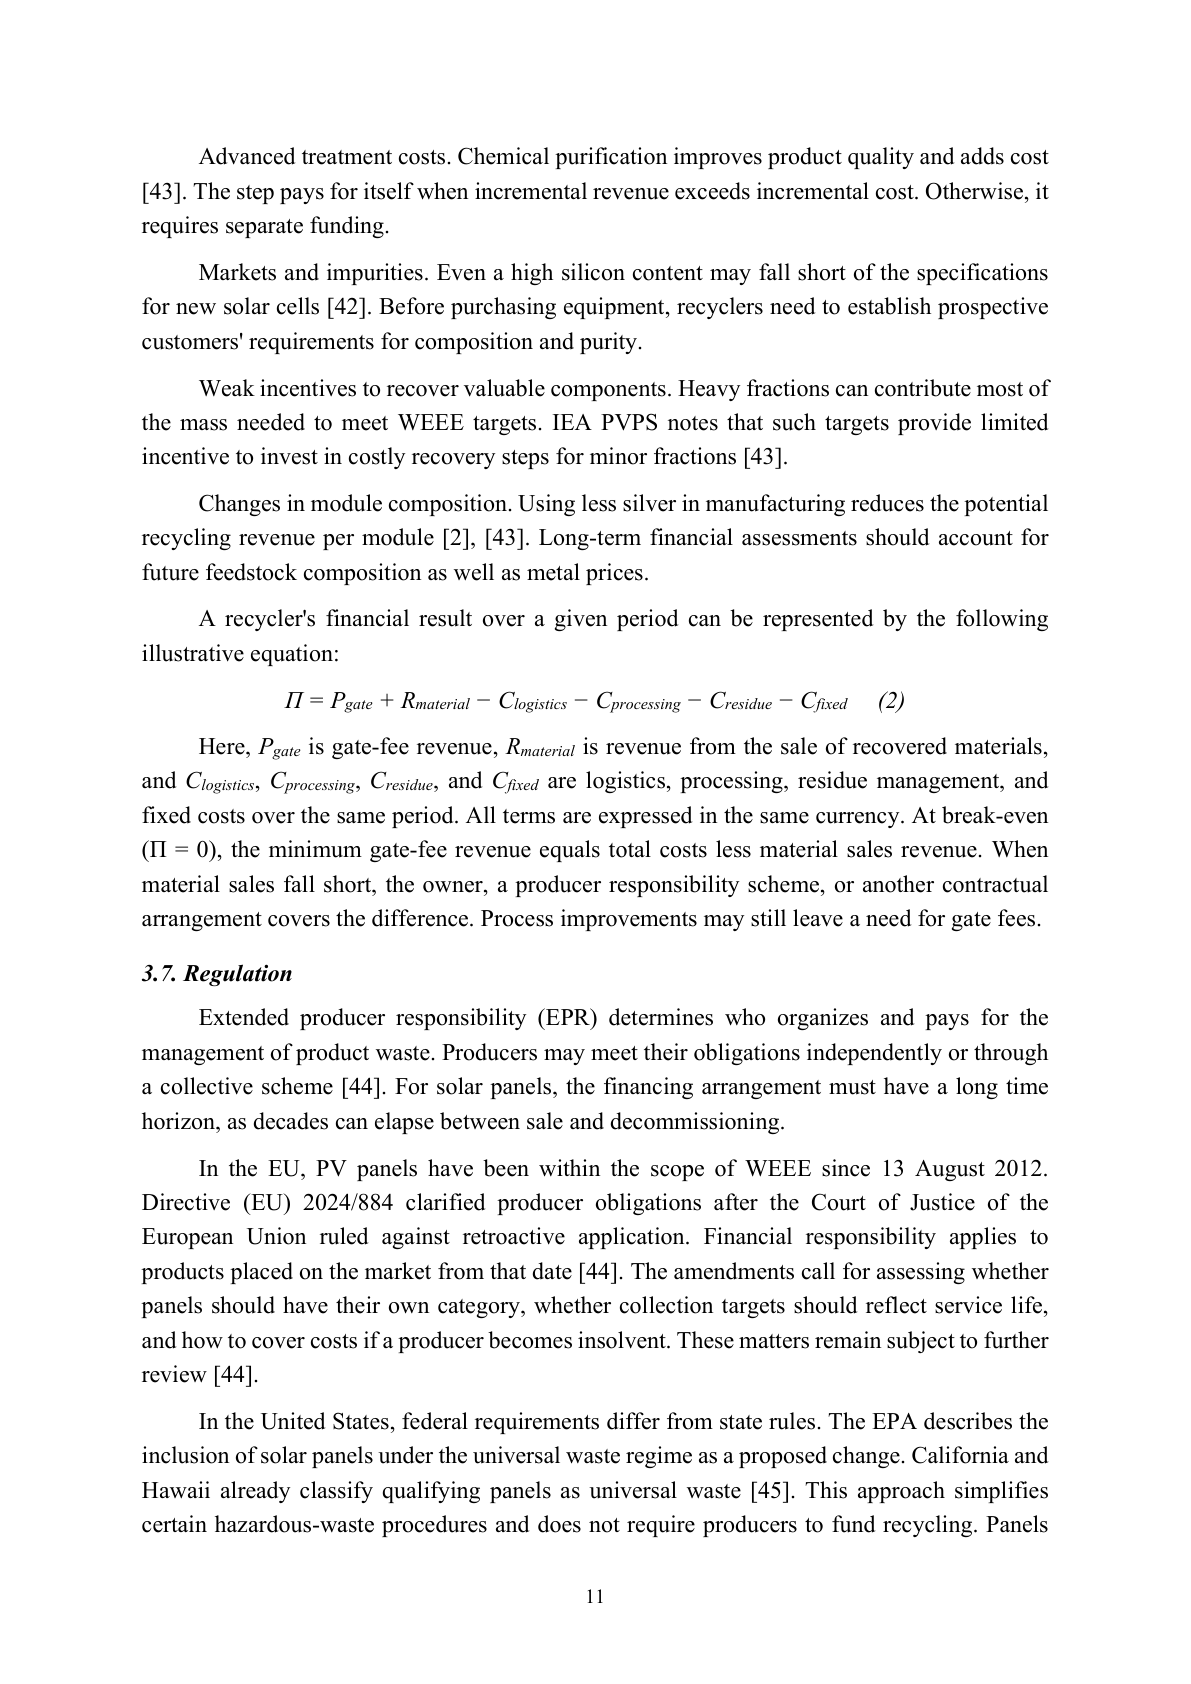
       A  recycler's  financial  result  over  a  given  period  can  be  represented  by  the  following
illustrative equation:
                  Π = Pgate + Rmaterial − Clogistics − Cprocessing − Cresidue − Cfixed     (2)
       Here, Pgate is gate-fee revenue, Rmaterial is revenue from the sale of recovered materials,
and Clogistics, Cprocessing,  Cresidue, and Cfixed are logistics, processing, residue management, and
fixed costs over the same period. All terms are expressed in the same currency. At break-even
(Π = 0), the minimum gate-fee revenue equals total costs less material sales revenue. When
material sales fall short, the owner, a producer responsibility scheme, or another contractual
arrangement covers the difference. Process improvements may still leave a need for gate fees.

3.7. Regulation
       Extended  producer  responsibility  (EPR)  determines  who  organizes  and  pays  for  the
management of product waste. Producers may meet their obligations independently or through
a collective scheme [44]. For solar panels, the financing arrangement must have a long time
horizon, as decades can elapse between sale and decommissioning.
       In  the  EU,  PV  panels  have  been  within  the  scope  of  WEEE  since  13  August  2012.
Directive  (EU)  2024/884  clarified  producer  obligations  after  the  Court  of  Justice  of  the
European  Union  ruled  against  retroactive  application.  Financial  responsibility  applies  to
products placed on the market from that date [44]. The amendments call for assessing whether
panels should have their own category, whether collection targets should reflect service life,
and how to cover costs if a producer becomes insolvent. These matters remain subject to further
review [44].
       In the United States, federal requirements differ from state rules. The EPA describes the
inclusion of solar panels under the universal waste regime as a proposed change. California and
Hawaii  already  classify  qualifying  panels  as  universal  waste  [45].  This  approach  simplifies
certain hazardous-waste procedures and does not require producers to fund recycling. Panels


                                                          11
Page 12
are safe in normal use. Whether a discarded panel is classified as hazardous waste depends on
its composition and the leaching of metals such as lead and cadmium [1].
       Washington State's program, adopted in 2017, requires manufacturers to fund take                               -back
and recycling without charging panel owners [46]. Under the 2025 amendments, plans are due
by 31 January 2030, and the ban on selling panels without an approved plan take                             s effect on 31
January  2031  [47].  The  timeline  illustrates  the  interval  that  can  separate  enactment  from
implementation.

Table 6. Scope and limits of regulation

 Regulation can                                            Regulation alone cannot guarantee
 Assign responsibility and identify a funding              Plant profitability
 source
 Set collection and treatment requirements                 High-purity silicon or glass
 Mandate reporting                                         Reliable reporting without oversight
 Restrict improper handling                                Buyers for recovered materials
 Create demand for recycling services                      Commercial readiness of new technologies


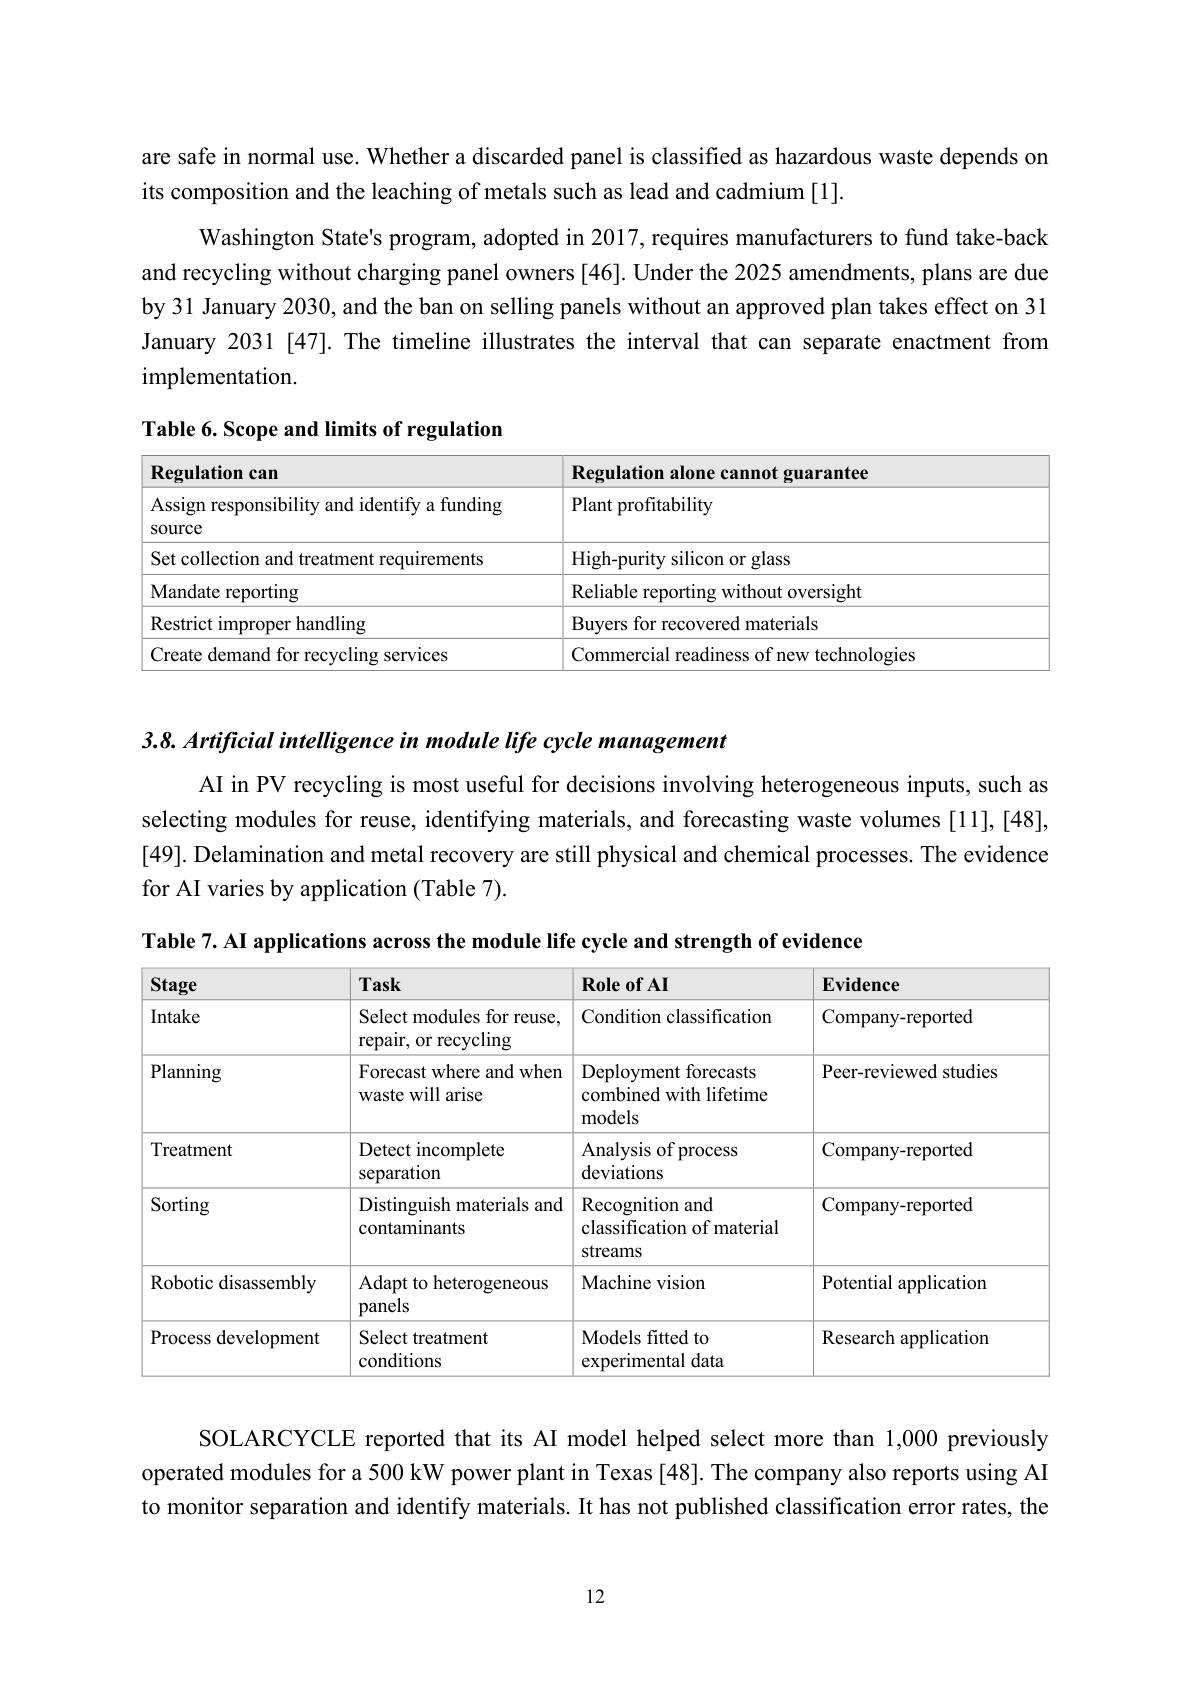
3.8. Artificial intelligence in module life cycle management
       AI in PV recycling is most useful for decisions involving heterogeneous inputs, such as
selecting modules for reuse, identifying materials, and forecasting waste volumes [11], [48],
[49]. Delamination and metal recovery are still physical and chemical proc                         esses. The evidence
for AI varies by application (Table 7).

Table 7. AI applications across the module life cycle and strength of evidence

 Stage                        Task                           Role of AI                       Evidence
 Intake                       Select modules for reuse,      Condition classification         Company-reported
                              repair, or recycling
 Planning                     Forecast where and when        Deployment forecasts             Peer-reviewed studies
                              waste will arise               combined with lifetime
                                                             models
 Treatment                    Detect incomplete              Analysis of process              Company-reported
                              separation                     deviations
 Sorting                      Distinguish materials and      Recognition and                  Company-reported
                              contaminants                   classification of material
                                                             streams
 Robotic disassembly          Adapt to heterogeneous         Machine vision                   Potential application
                              panels
 Process development          Select treatment               Models fitted to                 Research application
                              conditions                     experimental data

       SOLARCYCLE  reported  that  its  AI  model  helped  select  more  than  1,000  previously
operated modules for a 500 kW power plant in Texas [48]. The company also reports using AI
to monitor separation and identify materials. It has not published classification erro                          r rates, the


                                                             12
Page 13
subsequent  service  life  of  the  modules,  or  results  from  a  control  process  without  AI.  The
available information does not support a quantitative estimate of the algorithm's effect.
       A.  Franzoni  and  colleagues  used  installation  data  for  2008             –2024  and  socioeconomic
indicators   from   20   Italian   regions   [49].   They   compared   linear   regression,   ARIMA,   a
backpropagation neural network (BPNN), and a long short                  -term memory network (LSTM). The
BPNN  performed  best.  It  forecast  installed  capacity,  which  the  authors  then  converted  to
estimated  waste  volumes  using  a  Weibull  distribution.  Four  coauthors  work  for  the  energy
company A2A S.p.A., an affiliation relevant to assessing the study's independence                       .

4. Discussion

4.1. Why high recycling rates do not establish a closed material loop
       Four metrics are needed to compare technologies: the fraction of mass sent to material
recycling, the recovery yield for each target element, product purity, and the fraction of product
that actually re-enters the intended manufacturing process. For silver, recovery yield is the mass
of silver in the final product divided by the mass of silver in the original module. Purity is the
silver  mass  divided  by  the  total  mass  of  the  product.  Both  are  percentages  with  different
denominators. Even silicon at 99.9% purity may fail to meet solar cell specifications because
of the impurities present. Silver recovered from powder also tells us little about losses upstream
[6],  [17].  The  2024  IEA  PVPS  report  compared  some  technologies  only  at  the  stage  of
separating  cells    from  glass  and  polymers  [6].  Those  data  cannot  establish  which  process
performs best across the full recycling chain.

4.2. Consequences of limited progress in technology and organization
       Basic PV module recycling is already available [6], [50]. The risks examined here arise
from continued reliance on current practices, which leave some valuable materials unrecovered
and limit the quality and traceability of recovered fractions.
   –   Plants are likely to continue recovering mainly aluminum frames and glass. High mass-
       based recovery can coexist with losses of silver and silicon [6]. Even advanced recycling
       cannot quickly replace virgin feedstocks. In a growing market, new modules require more
       material than retired modules supply [51].
   –   When recycling costs exceed recovered material value, panels may remain in storage for
       extended  periods.  Without  records  of  condition  and  intended  use,  it  is  difficult  to
       distinguish modules held for reuse from waste awaiting disposal. The risk depends on
       storage rules and contract terms [2], [3].
   –   If processes are developed only after modules reach end of life, plants may be unprepared
       for large volumes of retired glass–glass, multilayer, perovskite, or tandem modules [10],
       [18].


                                                          13
Page 14
–   Improper  treatment  can  cause  losses  of  recoverable  materials,  generate  fine  mixed
       fractions, release hazardous constituents, and contaminate process solutions [1], [6].
   –   Public  confidence  in  municipal  environmental  programs  may  decline  if  they  lack
       provisions for end-of-life modules.
   –   Distribution  grids  must  accommodate  bidirectional  flows  from  rooftop  installations,
       storage, and electric vehicles. Grid investment is lagging behind generation growth [52],
       [53]. Without upgrades, some generation may be curtailed or go unused.
       The risks point to gradual losses of materials and money, idle recycling capacity, and
limits on usable solar generation.

4.3. Implications for urban development
       The studies reviewed do not establish an effect of solar energy on urbanization rates or
the share of the population living in cities. The main change is in how buildings interact with
the energy system. They generate electricity as well as consuming it [5                   2]. This affects roof use,
grid operation, how benefits are shared among residents, and how equipment is maintained.
       Rooftops   serve   several   functions.   Design   must   account   for   heritage   constraints,
maintenance   access,   building   services,   vegetation,   and   stormwater   retention   [4],   [40].
Preliminary  results  from  the  Mannoury  project  in  Amsterdam  showed  that  panels  over  an
irrigated blue-green roof generated about 4.5% more electricity than those over a bitumen roof
[54]. The result applies to this site. The vegetation and roof assembly provide cooling and water
retention.

       In multistory buildings, roof area per unit of gross floor area falls as the number of stories
increases. With identical floor plates, the ratio is approximately 0.1 for a 10                  -story building and
0.05  for  a  20-story  building.  This  geometric  illustration  excl              udes  mechanical  floors  and
installation constraints. In Singapore, rooftop panels primarily serve common building loads
[41]. The example provides no basis for recommending a shift to low                      -rise construction.
       Generation and demand do not always coincide. At the district scale, this calls for load
management, storage, and shared resources [4], [52]. Even an annual electricity surplus cannot
guarantee self-sufficiency in every hour.

       Residents' access to solar generation depends on ownership, roof access, and the ability
to  pay  for  installation.  Multifamily  buildings  and  public  housing  therefore  require  specific
arrangements [4], [38].
       Wider deployment creates demand for testing, repair, dismantling, sorting, and recycling
[50]. Sustaining these services depends on plant utilization, workforce skills, and markets for
recovered materials.


                                                           14
Page 15
4.4. The full solar life cycle city model
        The proposed full solar life cycle city model is a municipal framework for recording and
servicing  solar  installations  and  deciding  in  advance  where  the  equipment  will  go  after
dismantling. It draws on published approaches [2], [3], [6] and requires testin                              g in a specific
city.

Table 8. Stages of the proposed module life cycle management model

 Stage                           Actions                                                Verifiable outcome
 1. Design and                   Select materials with future separation in             Defined disassembly route without
 procurement                     mind, document their composition, and                  reduced durability
                                 include take-back terms in the supply
                                 contract.
 2. Commissioning                Enter the installation in the municipal                Traceability of each installation
                                 registry, assign responsibility, and confirm
                                 the supplier's participation in an EPR
                                 scheme.
 3. Operation                    Record defects, repairs, and replacements.             Records that support decisions
                                 Coordinate with roof maintenance.                      about continued use
 4. Pre-decommissioning          Check performance, electrical safety, and              Allocation to reuse, repair, or
 assessment                      repairability.                                         recycling
 5. Dismantling and              Use qualified contractors and local                    Module identification and
 consolidation                   consolidation points.                                  condition preserved
 6. Intake and sorting           Identify technology, design, damage, and               Separate streams for c-Si, CdTe,
                                 hazardous components.                                  and other technologies
 7. Recycling                    Carry out preliminary disassembly,                     Products with verified
                                 delamination, recovery, and purification at a          specifications
                                 regional facility.
 8. Material recovery and        Send recovered materials to users according            Verified end uses and a
 reporting                       to their specifications, manage residues, and          documented route for the entire
                                 reconcile the mass balance.                            batch mass

        Five measures support implementation of the stages in Table 8.

    –   Equipment registry. The registry records the installation address, owner, module models
        and quantities, commissioning date, composition, repair history, and take                            -back terms. It
        supports  forecasting  and  planning.  A  fixed  retirement  date  25  years  after  insta                       llation
        would ignore variation in actual service life. In a simple model for a cohort of mass                                  M
        installed in the same year, the expected mass retired between ages                         a and b is M × [F(b) −
        F(a)], where F is the cumulative probability of retirement. A numerical forecast requires
        distribution parameters for different module types and ages. This review did not estimate
        those parameters.
    –   Pre-decommissioning  assessment.  Higher  efficiency  in  a  new  panel  is  insufficient  to
        establish the life cycle benefits of replacing a functioning installation. Removed modules
        should be reused only after they pass safety and performance checks [2].


                                                               15
Page 16
–   Regional recycling. Cities can host collection and assessment points. Large specialized
       facilities can serve a wider region, with location and capacity chosen in light of expected
       waste volumes and transport requirements [3].
   –   Procurement requirements. Supply contracts should specify the technical documents the
       supplier must provide and the method of identifying individual modules. They should
       itemize  the  services  covered,  including  removal,  packaging,  transport,  and  treatment.
       Contracts should also define what happens if a building changes hands or the supplier
       ceases  trading.  Reports  should  distinguish  accepted  module  mass,  material  recycling,
       energy recovery, and residues. These terms supplement EPR obligations [44].
   –   Digital tools and AI. Algorithms can read labels and documents. Where composition data
       are  missing,  the  registry  should  record  the  composition  as  “unknown.”  A  generative
       model should not infer the missing composition. AI can support condition assessment,
       but safety clearance requires a separate decision. Uncertain cases go to manual review.
       Waste  forecasts  should  report  scenario  ranges  and  may  use  hybrid  models  [49].
       Conventional  optimization  methods  are  sufficient  for  routing.  Process  control  should
       retain independent safety interlocks.
       Installed  PV  capacity  is  one  measure  of  program  performance.  Table  9  also  covers
operational, social, and material outcomes.

Table 9. Proposed performance indicators for a full solar life cycle city

 Area                                 Indicators
 Energy                               Actual generation, curtailment, and self-consumption
 Reliability                          Failures, repair time, and verified service life
 Equitable access                     Participation of public housing and lower-income households
 Reuse                                Number of modules that passed testing and were reinstalled
 Collection                           Share of end-of-life equipment entering a controlled system
 Recycling                            Recovery of individual materials, their purity, and their end uses
 Residual waste                       Mass and verified management route
 Economics                            Total life cycle cost and cost of meeting obligations

       Evaluating  AI  requires  comparing  the  same  process  with  and  without  the  algorithm.
Relevant measures include treatment cost per tonne, including digital system operation, as well
as  target  material  yield  and  purity  and  consumption  of  energy,  water,  and  reag                     ents.  For
condition assessment, additional measures include the number of modules safely reinstalled,
the false clearance rate, and the share of cases requiring manual review. The false clearance rate
can be defined as the number of unsafe modules incorrec                     tly cleared for operation divided by
the  total  number  of  unsafe  modules  in  the  validation  sample.  Calculating  it  requires  an
independent reference assessment, the sample size, and the error count. Comparisons should
use similar batches to avoid attributing           differences in feedstock quality to AI.


                                                            16
Page 17
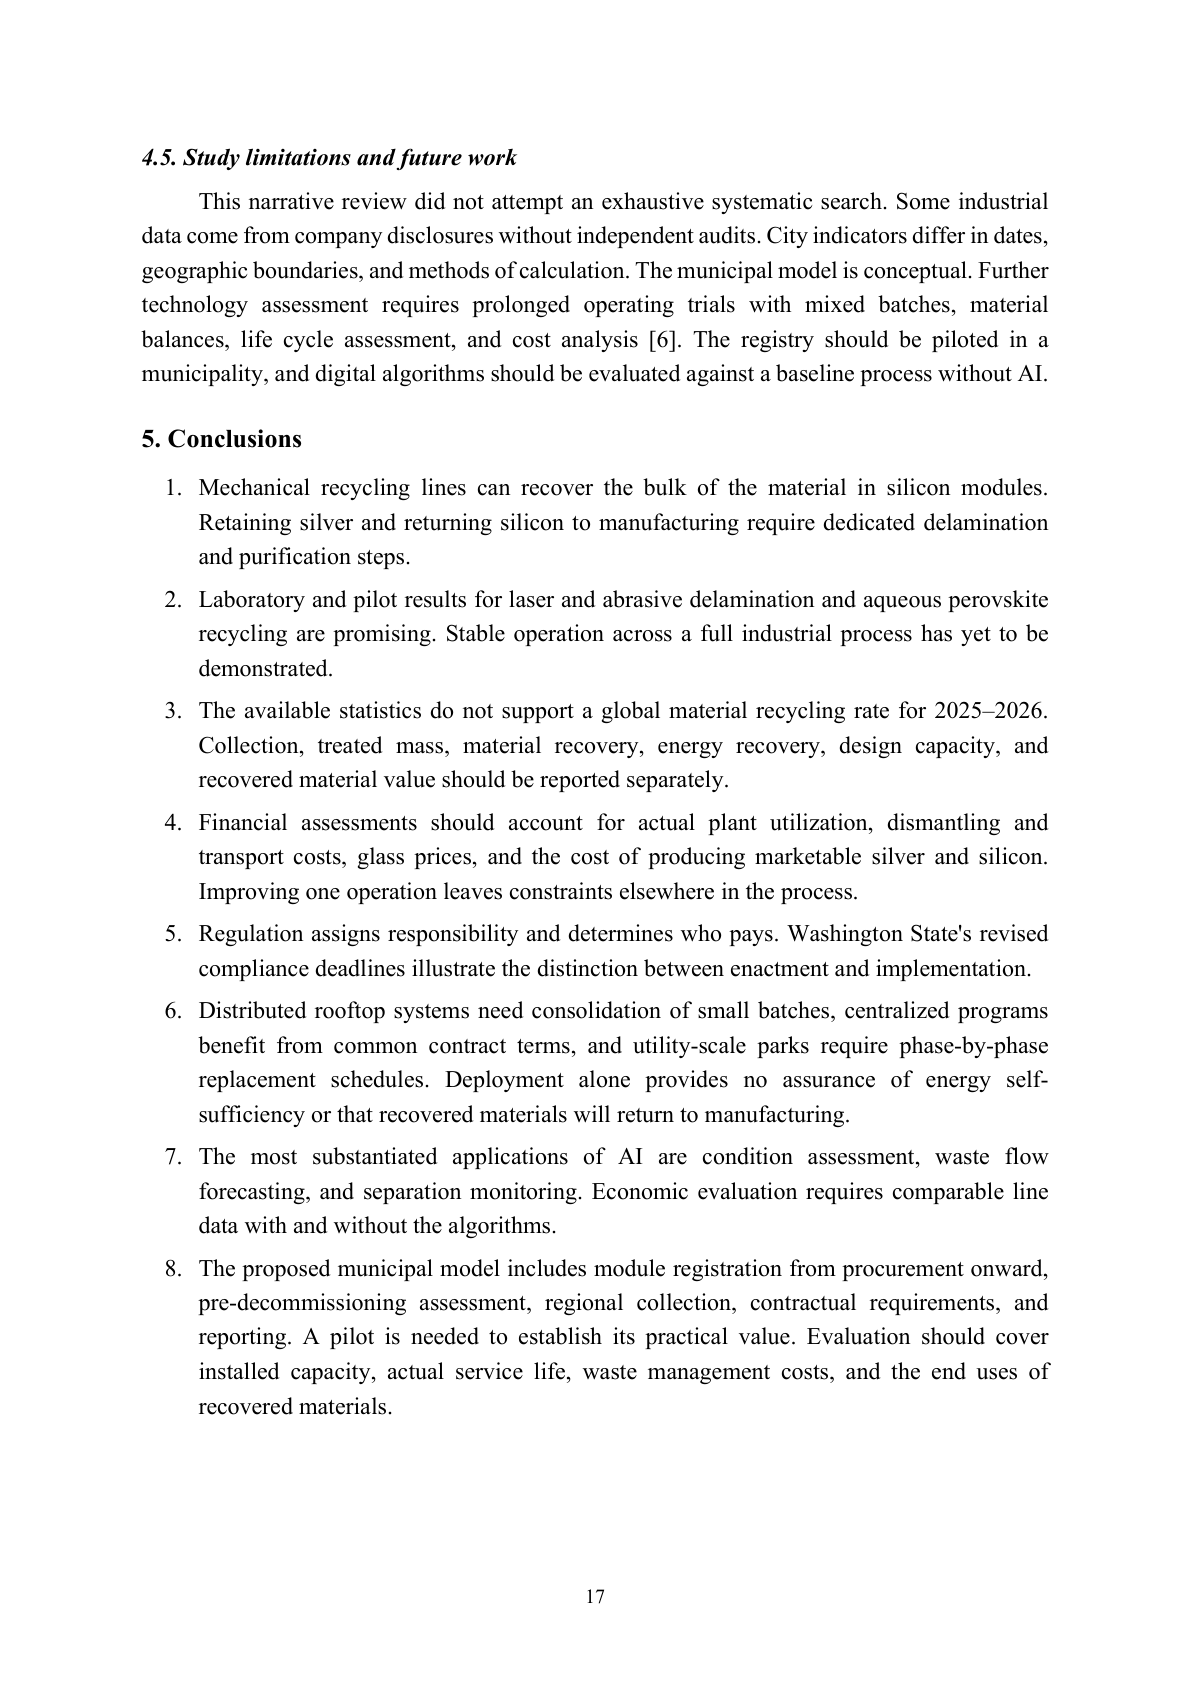
4.5. Study limitations and future work
       This narrative review did not attempt an exhaustive systematic search. Some industrial
data come from company disclosures without independent audits. City indicators differ in dates,
geographic boundaries, and methods of calculation. The municipal model is                      conceptual. Further
technology  assessment  requires  prolonged  operating  trials  with  mixed  batches,  material
balances,  life  cycle  assessment,  and  cost  analysis  [6].  The  registry  should  be  piloted  in  a
municipality, and digital algorithms should be evaluated               against a baseline process without AI.

5. Conclusions

  1.   Mechanical  recycling  lines  can  recover  the  bulk  of  the  material  in  silicon  modules.
       Retaining silver and returning silicon to manufacturing require dedicated delamination
       and purification steps.
  2.   Laboratory and pilot results for laser and abrasive delamination and aqueous perovskite
       recycling are promising. Stable operation across a full industrial process has yet to be
       demonstrated.
  3.   The available statistics do not support a global material recycling rate for 2025–2026.
       Collection,  treated  mass,  material  recovery,  energy  recovery,  design  capacity,  and
       recovered material value should be reported separately.
  4.   Financial  assessments  should  account  for  actual  plant  utilization,  dismantling  and
       transport  costs,  glass  prices,  and  the  cost  of  producing  marketable  silver  and  silicon.
       Improving one operation leaves constraints elsewhere in the process.
  5.   Regulation assigns responsibility and determines who pays. Washington State's revised
       compliance deadlines illustrate the distinction between enactment and implementation.
  6.   Distributed rooftop systems need consolidation of small batches, centralized programs
       benefit  from  common  contract  terms,  and  utility-scale  parks  require  phase-by-phase
       replacement  schedules.  Deployment  alone  provides  no  assurance  of  energy  self-
       sufficiency or that recovered materials will return to manufacturing.
  7.   The  most  substantiated  applications  of  AI  are  condition  assessment,  waste  flow
       forecasting, and separation monitoring. Economic evaluation requires comparable line
       data with and without the algorithms.
  8.   The proposed municipal model includes module registration from procurement onward,
       pre-decommissioning  assessment,  regional  collection,  contractual  requirements,  and
       reporting.  A  pilot  is  needed  to  establish  its  practical  value.  Evaluation  should  cover
       installed  capacity,  actual  service  life,  waste  management  costs,  and  the  end  uses  of
       recovered materials.


                                                          17
Page 18
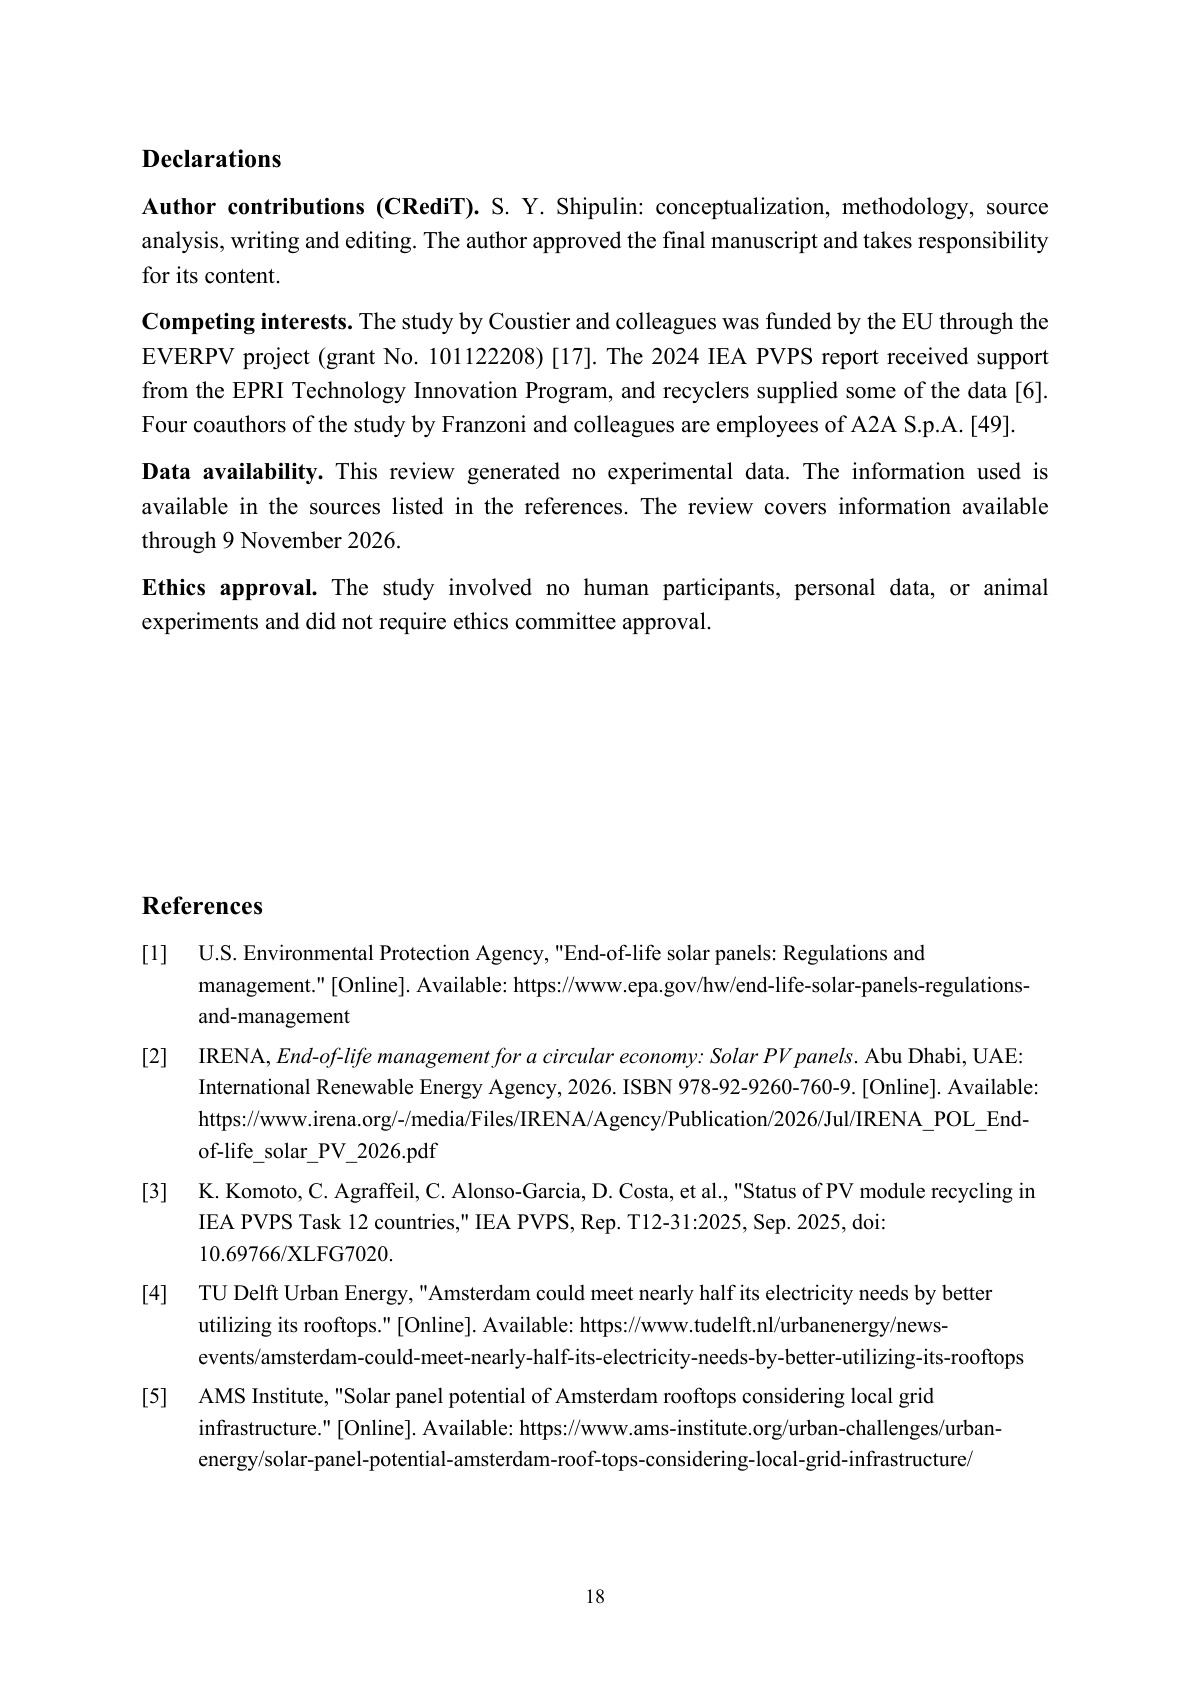
Declarations
Author  contributions  (CRediT).              S.  Y.  Shipulin:  conceptualization,  methodology,  source
analysis, writing and editing. The author approved the final manuscript and takes responsibility
for its content.
Competing interests. The study by Coustier and colleagues was funded by the EU through the
EVERPV project (grant No. 101122208) [17]. The 2024 IEA PVPS report received support
from the EPRI Technology Innovation Program, and recyclers supplied some of the data [6].
Four coauthors of the study by Franzoni and colleagues are employees of A2A S.p.A. [49].
Data  availability.      This  review  generated  no  experimental  data.  The  information  used  is
available  in  the  sources  listed  in  the  references.  The  review  covers  information  available
through 9 November 2026.
Ethics  approval.        The  study  involved  no  human  participants,  personal  data,  or  animal
experiments and did not require ethics committee approval.


References

[1]    U.S. Environmental Protection Agency, "End-of-life solar panels: Regulations and
       management." [Online]. Available: https://www.epa.gov/hw/end-life-solar-panels-regulations-
       and-management
[2]    IRENA, End-of-life management for a circular economy: Solar PV panels. Abu Dhabi, UAE:
       International Renewable Energy Agency, 2026. ISBN 978-92-9260-760-9. [Online]. Available:
       https://www.irena.org/-/media/Files/IRENA/Agency/Publication/2026/Jul/IRENA_POL_End-
       of-life_solar_PV_2026.pdf
[3]    K. Komoto, C. Agraffeil, C. Alonso-Garcia, D. Costa, et al., "Status of PV module recycling in
       IEA PVPS Task 12 countries," IEA PVPS, Rep. T12-31:2025, Sep. 2025, doi:
       10.69766/XLFG7020.
[4]    TU Delft Urban Energy, "Amsterdam could meet nearly half its electricity needs by better
       utilizing its rooftops." [Online]. Available: https://www.tudelft.nl/urbanenergy/news-
       events/amsterdam-could-meet-nearly-half-its-electricity-needs-by-better-utilizing-its-rooftops
[5]    AMS Institute, "Solar panel potential of Amsterdam rooftops considering local grid
       infrastructure." [Online]. Available: https://www.ams-institute.org/urban-challenges/urban-
       energy/solar-panel-potential-amsterdam-roof-tops-considering-local-grid-infrastructure/


                                                          18
Page 19
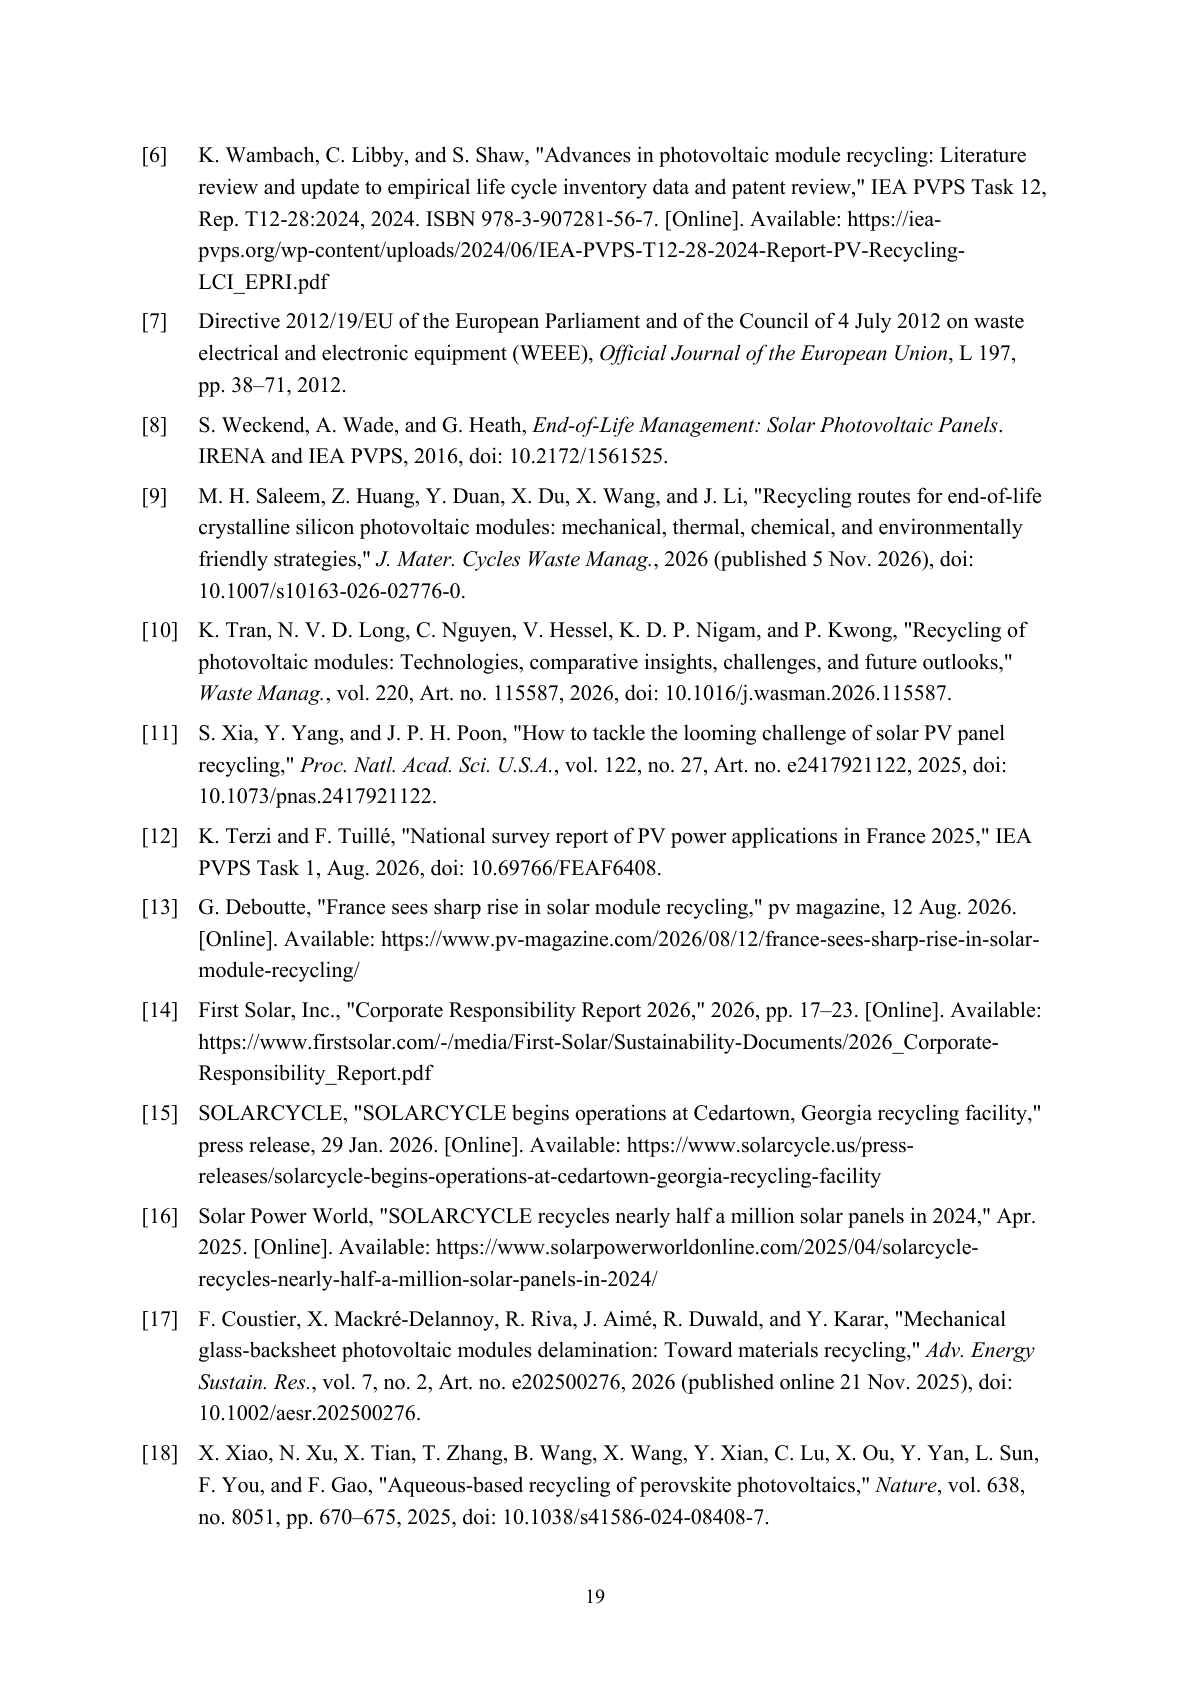
[6]    K. Wambach, C. Libby, and S. Shaw, "Advances in photovoltaic module recycling: Literature
       review and update to empirical life cycle inventory data and patent review," IEA PVPS Task 12,
       Rep. T12-28:2024, 2024. ISBN 978-3-907281-56-7. [Online]. Available: https://iea-
       pvps.org/wp-content/uploads/2024/06/IEA-PVPS-T12-28-2024-Report-PV-Recycling-
       LCI_EPRI.pdf
[7]    Directive 2012/19/EU of the European Parliament and of the Council of 4 July 2012 on waste
       electrical and electronic equipment (WEEE), Official Journal of the European Union, L 197,
       pp. 38–71, 2012.
[8]    S. Weckend, A. Wade, and G. Heath, End-of-Life Management: Solar Photovoltaic Panels.
       IRENA and IEA PVPS, 2016, doi: 10.2172/1561525.
[9]    M. H. Saleem, Z. Huang, Y. Duan, X. Du, X. Wang, and J. Li, "Recycling routes for end-of-life
       crystalline silicon photovoltaic modules: mechanical, thermal, chemical, and environmentally
       friendly strategies," J. Mater. Cycles Waste Manag., 2026 (published 5 Nov. 2026), doi:
       10.1007/s10163-026-02776-0.
[10]   K. Tran, N. V. D. Long, C. Nguyen, V. Hessel, K. D. P. Nigam, and P. Kwong, "Recycling of
       photovoltaic modules: Technologies, comparative insights, challenges, and future outlooks,"
       Waste Manag., vol. 220, Art. no. 115587, 2026, doi: 10.1016/j.wasman.2026.115587.
[11]   S. Xia, Y. Yang, and J. P. H. Poon, "How to tackle the looming challenge of solar PV panel
       recycling," Proc. Natl. Acad. Sci. U.S.A., vol. 122, no. 27, Art. no. e2417921122, 2025, doi:
       10.1073/pnas.2417921122.
[12]   K. Terzi and F. Tuillé, "National survey report of PV power applications in France 2025," IEA
       PVPS Task 1, Aug. 2026, doi: 10.69766/FEAF6408.
[13]   G. Deboutte, "France sees sharp rise in solar module recycling," pv magazine, 12 Aug. 2026.
       [Online]. Available: https://www.pv-magazine.com/2026/08/12/france-sees-sharp-rise-in-solar-
       module-recycling/
[14]   First Solar, Inc., "Corporate Responsibility Report 2026," 2026, pp. 17–23. [Online]. Available:
       https://www.firstsolar.com/-/media/First-Solar/Sustainability-Documents/2026_Corporate-
       Responsibility_Report.pdf
[15]   SOLARCYCLE, "SOLARCYCLE begins operations at Cedartown, Georgia recycling facility,"
       press release, 29 Jan. 2026. [Online]. Available: https://www.solarcycle.us/press-
       releases/solarcycle-begins-operations-at-cedartown-georgia-recycling-facility
[16]   Solar Power World, "SOLARCYCLE recycles nearly half a million solar panels in 2024," Apr.
       2025. [Online]. Available: https://www.solarpowerworldonline.com/2025/04/solarcycle-
       recycles-nearly-half-a-million-solar-panels-in-2024/
[17]   F. Coustier, X. Mackré-Delannoy, R. Riva, J. Aimé, R. Duwald, and Y. Karar, "Mechanical
       glass-backsheet photovoltaic modules delamination: Toward materials recycling," Adv. Energy
       Sustain. Res., vol. 7, no. 2, Art. no. e202500276, 2026 (published online 21 Nov. 2025), doi:
       10.1002/aesr.202500276.
[18]   X. Xiao, N. Xu, X. Tian, T. Zhang, B. Wang, X. Wang, Y. Xian, C. Lu, X. Ou, Y. Yan, L. Sun,
       F. You, and F. Gao, "Aqueous-based recycling of perovskite photovoltaics," Nature, vol. 638,
       no. 8051, pp. 670–675, 2025, doi: 10.1038/s41586-024-08408-7.


                                                            19
Page 20
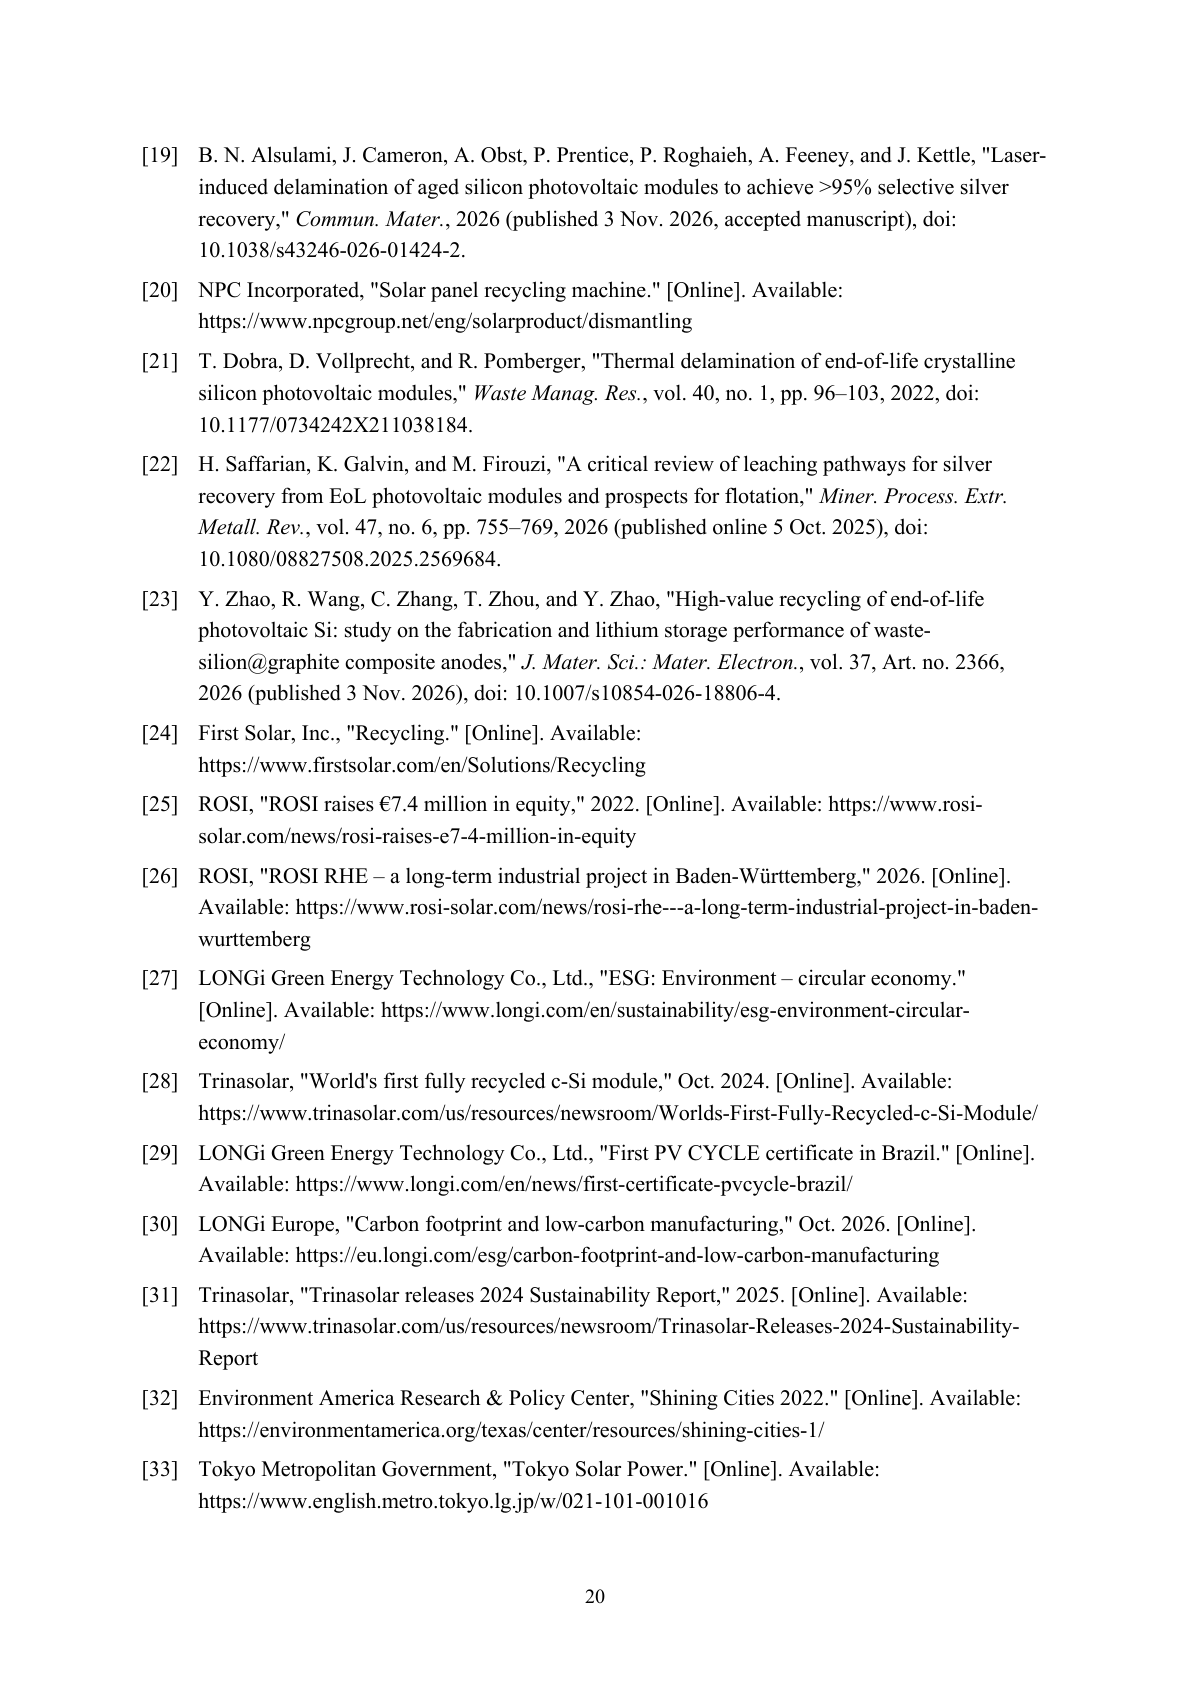
[19]   B. N. Alsulami, J. Cameron, A. Obst, P. Prentice, P. Roghaieh, A. Feeney, and J. Kettle, "Laser-
       induced delamination of aged silicon photovoltaic modules to achieve >95% selective silver
       recovery," Commun. Mater., 2026 (published 3 Nov. 2026, accepted manuscript), doi:
       10.1038/s43246-026-01424-2.
[20]   NPC Incorporated, "Solar panel recycling machine." [Online]. Available:
       https://www.npcgroup.net/eng/solarproduct/dismantling
[21]   T. Dobra, D. Vollprecht, and R. Pomberger, "Thermal delamination of end-of-life crystalline
       silicon photovoltaic modules," Waste Manag. Res., vol. 40, no. 1, pp. 96–103, 2022, doi:
       10.1177/0734242X211038184.
[22]   H. Saffarian, K. Galvin, and M. Firouzi, "A critical review of leaching pathways for silver
       recovery from EoL photovoltaic modules and prospects for flotation," Miner. Process. Extr.
       Metall. Rev., vol. 47, no. 6, pp. 755–769, 2026 (published online 5 Oct. 2025), doi:
       10.1080/08827508.2025.2569684.
[23]   Y. Zhao, R. Wang, C. Zhang, T. Zhou, and Y. Zhao, "High-value recycling of end-of-life
       photovoltaic Si: study on the fabrication and lithium storage performance of waste-
       silion@graphite composite anodes," J. Mater. Sci.: Mater. Electron., vol. 37, Art. no. 2366,
       2026 (published 3 Nov. 2026), doi: 10.1007/s10854-026-18806-4.
[24]   First Solar, Inc., "Recycling." [Online]. Available:
       https://www.firstsolar.com/en/Solutions/Recycling
[25]   ROSI, "ROSI raises €7.4 million in equity," 2022. [Online]. Available: https://www.rosi-
       solar.com/news/rosi-raises-e7-4-million-in-equity
[26]   ROSI, "ROSI RHE – a long-term industrial project in Baden-Württemberg," 2026. [Online].
       Available: https://www.rosi-solar.com/news/rosi-rhe---a-long-term-industrial-project-in-baden-
       wurttemberg
[27]   LONGi Green Energy Technology Co., Ltd., "ESG: Environment – circular economy."
       [Online]. Available: https://www.longi.com/en/sustainability/esg-environment-circular-
       economy/
[28]   Trinasolar, "World's first fully recycled c-Si module," Oct. 2024. [Online]. Available:
       https://www.trinasolar.com/us/resources/newsroom/Worlds-First-Fully-Recycled-c-Si-Module/
[29]   LONGi Green Energy Technology Co., Ltd., "First PV CYCLE certificate in Brazil." [Online].
       Available: https://www.longi.com/en/news/first-certificate-pvcycle-brazil/
[30]   LONGi Europe, "Carbon footprint and low-carbon manufacturing," Oct. 2026. [Online].
       Available: https://eu.longi.com/esg/carbon-footprint-and-low-carbon-manufacturing
[31]   Trinasolar, "Trinasolar releases 2024 Sustainability Report," 2025. [Online]. Available:
       https://www.trinasolar.com/us/resources/newsroom/Trinasolar-Releases-2024-Sustainability-
       Report
[32]   Environment America Research & Policy Center, "Shining Cities 2022." [Online]. Available:
       https://environmentamerica.org/texas/center/resources/shining-cities-1/
[33]   Tokyo Metropolitan Government, "Tokyo Solar Power." [Online]. Available:
       https://www.english.metro.tokyo.lg.jp/w/021-101-001016


                                                             20
Page 21
[34]   Tokyo Metropolitan Government, "Tokyo's mandate for the installation of solar power
       generation equipment on new residential buildings." [Online]. Available:
       https://www.english.metro.tokyo.lg.jp/documents/d/english/rooftops-pdf-pdf
[35]   Housing & Development Board, "Status of initiatives under HDB Green Towns Programme,"
       Annex, Feb. 2025. [Online]. Available: https://www.hdb.gov.sg/-/media/hdb-
       pulse/news/2025/hdb-to-extend-cool-coatings-initiative-to-all-existing-hdb-estates/03022025-
       Annex.pdf
[36]   Rotterdam Style, "Rotterdam leads in solar panels among Dutch cities," Dec. 2024. [Online].
       Available: https://rotterdamstyle.com/government/rotterdam-leads-in-solar-panels-among-
       dutch-cities
[37]   Dubai Electricity and Water Authority, "Mohammed bin Rashid Al Maktoum Solar Park."
       [Online]. Available: https://www.dewa.gov.ae/en/about-us/strategic-initiatives/mbr-solar-park
[38]   pv magazine, "Amsterdam tightens conditions around sustainable solar panel subsidy," 14 Jul.
       2026. [Online]. Available: https://www.pv-magazine.com/2026/07/14/amsterdam-tightens-
       conditions-around-sustainable-solar-panel-subsidy/
[39]   Housing & Development Board, "Sustainability Report 2023/2024." [Online]. Available:
       https://www.hdb.gov.sg/-/media/hdb-pulse/reports/annual-reports-and-financial-
       statements/HDB-SR-FY23.pdf
[40]   "Housing & Development Board Green Bonds: Second Party Opinion," 2025. [Online].
       Available: https://www.hdb.gov.sg/-/media/hdb-pulse/reports/green-finance-framework-and-
       reports/02-SPO-Report-2025.pdf
[41]   Housing & Development Board, "HDB Green Towns Programme," Annex C, 2022. [Online].
       Available: https://www.hdb.gov.sg/-/media/hdb-pulse/news/2022/greener-more-sustainable-
       homes/HDB-Green-Towns-Programme_Annex-C.pdf
[42]   IEA PVPS, "IEA PVPS Insights 2025," 2026. [Online]. Available: https://iea-pvps.org/wp-
       content/uploads/2026/03/IEA-PVPS-Insights-2025.pdf
[43]   IEA PVPS, "Trends in photovoltaic applications 2025," 2025. [Online]. Available: https://iea-
       pvps.org/wp-content/uploads/2025/10/IEA-PVPS_Trends_2025-.pdf
[44]   Directive (EU) 2024/884 of the European Parliament and of the Council of 13 March 2024
       amending Directive 2012/19/EU on waste electrical and electronic equipment (WEEE),
       CELEX: 32024L0884. [Online]. Available: https://eur-lex.europa.eu/eli/dir/2024/884
[45]   U.S. Environmental Protection Agency, "Universal waste." [Online]. Available:
       https://www.epa.gov/hw/universal-waste
[46]   Washington State Department of Ecology, "Solar panels." [Online]. Available:
       https://ecology.wa.gov/waste-toxics/reducing-recycling-waste/our-recycling-programs/solar-
       panels
[47]   Washington State Legislature, "Senate Bill Report SSB 5175," 2025. [Online]. Available:
       https://lawfilesext.leg.wa.gov/biennium/2025-26/Htm/Bill%20Reports/Senate/5175-
       S2%20SBR%20APS%2025.htm


                                                           21
Page 22
[48]   P. Dias, "The role of AI in solar circularity," SOLARCYCLE, 2026. [Online]. Available:
       https://www.solarcycle.us/resources/the-role-of-ai-in-solar-circularity
[49]   A. Franzoni, C. Leggerini, M. Bannò, M. Avanzini, and E. Vitto, "A multi-scale approach to
       photovoltaic waste prediction: Insights from Italy's current and future installations," Solar, vol.
       5, no. 3, Art. no. 32, 2025, doi: 10.3390/solar5030032.
[50]   U.S. Environmental Protection Agency, "Solar panel recycling." [Online]. Available:
       https://www.epa.gov/hw/solar-panel-recycling
[51]   International Energy Agency, "Potential contribution of module recycling to solar PV material
       demand under the Net Zero Scenario for selected materials, 2022–2050," chart. [Online].
       Available: https://www.iea.org/data-and-statistics/charts/potential-contribution-of-module-
       recycling-to-solar-pv-material-demand-under-the-net-zero-scenario-for-selected-materials-
       2022-2050
[52]   International Energy Agency, "Modernising grids in the age of electricity: The need for modern
       grids." [Online]. Available: https://www.iea.org/reports/modernising-grids-in-the-age-of-
       electricity/the-need-for-modern-grids
[53]   International Energy Agency, "World energy investment 2025: Executive summary," 2025.
       [Online]. Available: https://www.iea.org/reports/world-energy-investment-2025/executive-
       summary
[54]   Dutch Water Sector, "Blue-green roofs to increase energy yield of solar panels," 2023. [Online].
       Available: https://www.dutchwatersector.com/news/blue-green-roofs-to-increase-energy-yield-
       of-solar-panels
[55]   Soren, "Rapport d’activité Soren 2025," 2026. [Online]. Available:
       https://www.soren.eco/rapport-dactivite-soren-2025/
[56]   Soren, "Rapport d’activité Soren 2024," 2025. [Online]. Available:
       https://www.soren.eco/rapport-dactivite-soren-2024/
[57]   IEA PVPS Task 12, "Advances in photovoltaic module recycling: Third update to empirical life
       cycle inventory data," Apr. 2026. [Online]. Available: https://iea-pvps.org/key-topics/t12-
       advances-module-recycling-3rd-edition-2026/


                                                              22
Suggested Citation
Shipulin, S. Y. (2026). Photovoltaic Module Recycling in Urban Solar Energy Systems: Technologies, Economics, Regulation, and Artificial Intelligence. Smart World Journal, 1(3), Article v1i3-031. https://smartworldjournal.com/issues/vol1/issue3/articles/article31.html